
Client portal
Numex – the client portal for your actuarial valuations
For employee benefit clients: one place to send us your data and see how far each valuation has got, for all your companies, with your reports kept in each company's Reports library.
A look inside Numex
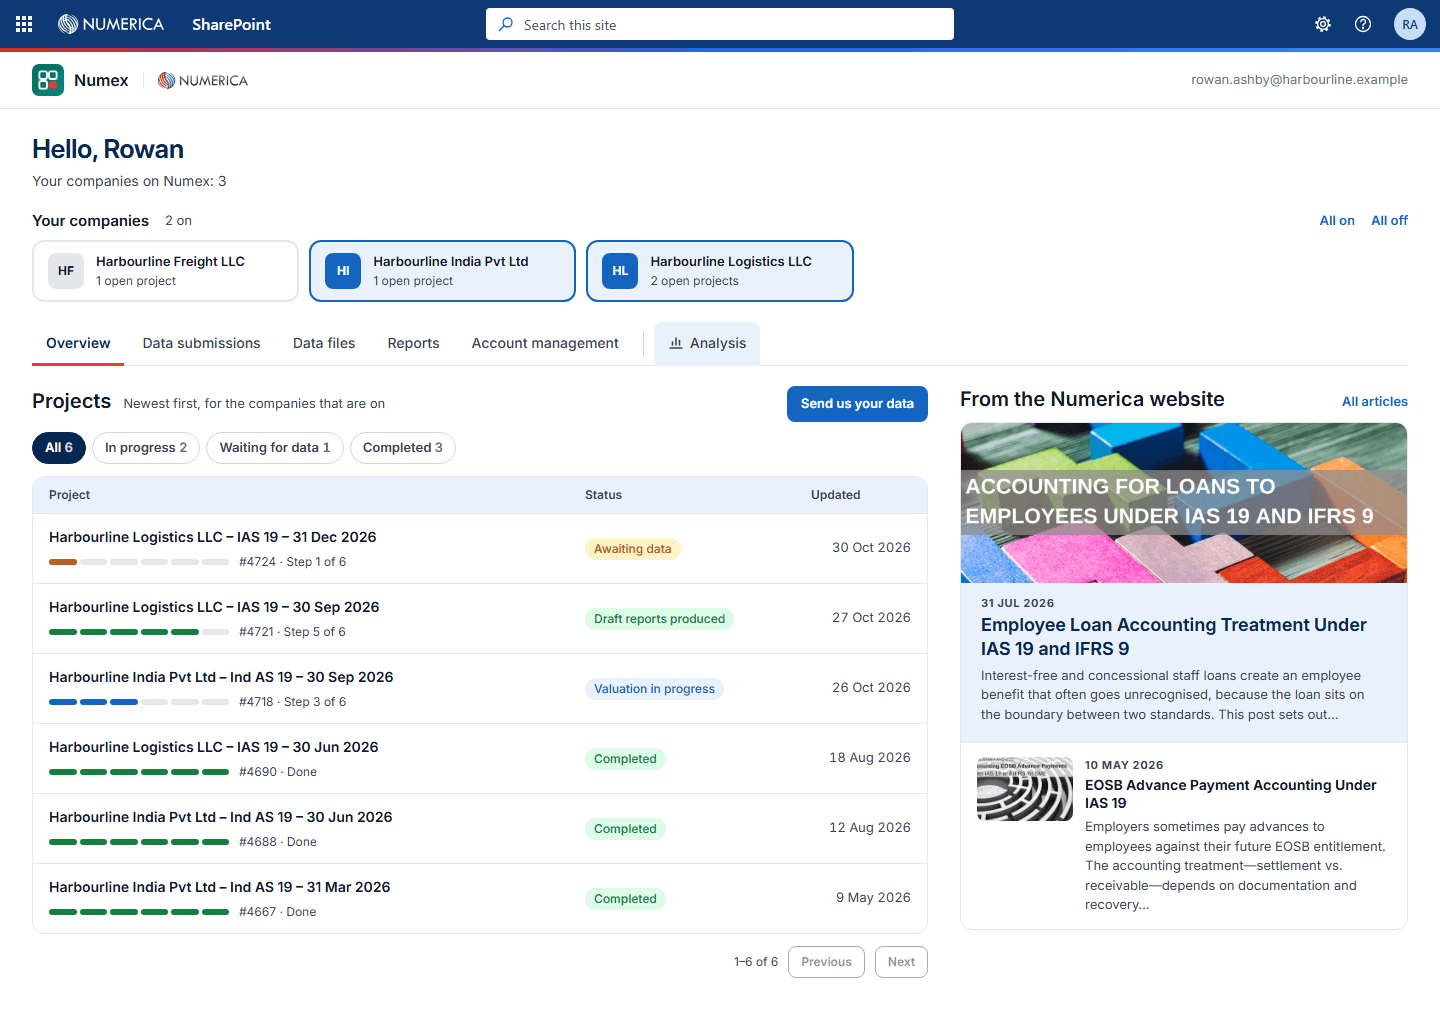
The "Overview" tab: your companies across the top, then every project, newest first, with a step bar showing how far it has got and what we need from you next. Sample company and data. 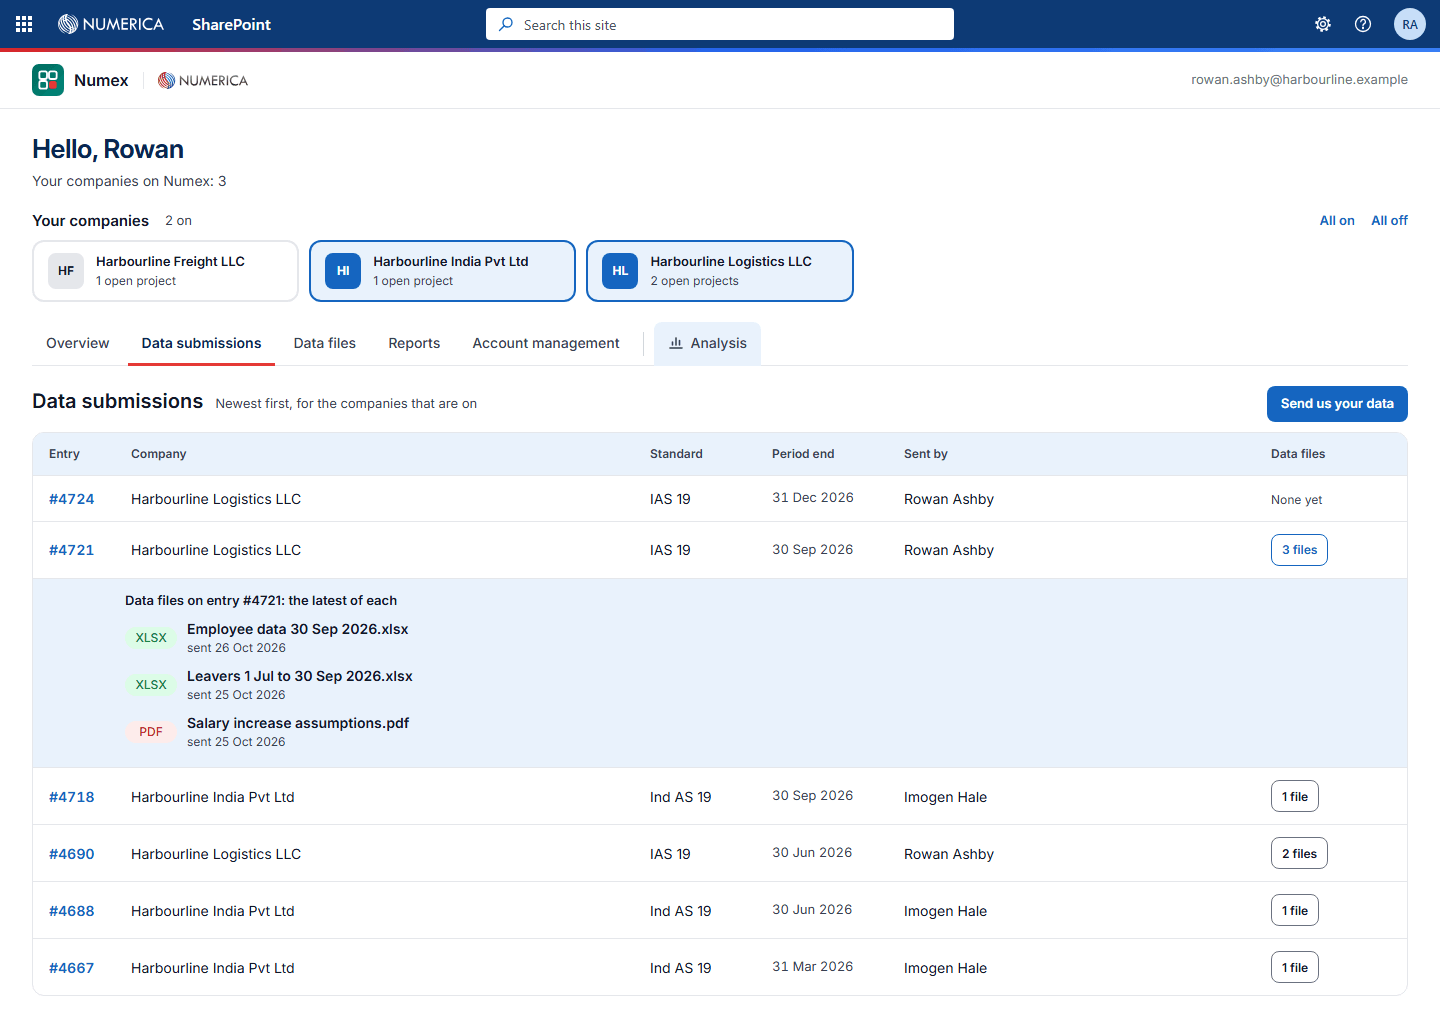
The "Data submissions" tab: send us your data and follow each submission, with the latest of each file you have sent on it. 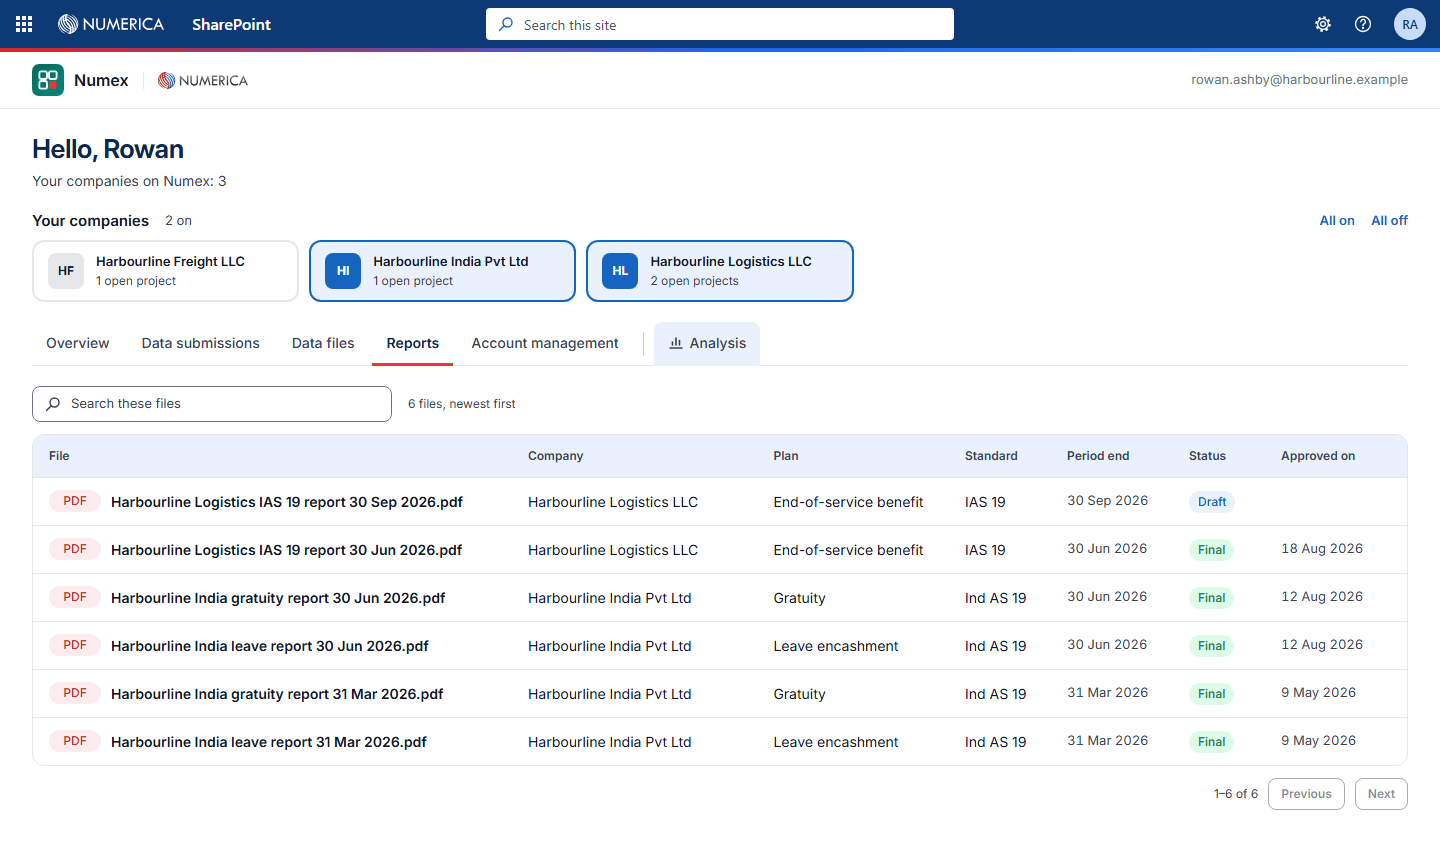
The "Reports" tab: your actuarial reports for every company, newest first, with the plan, standard, period end and status of each. 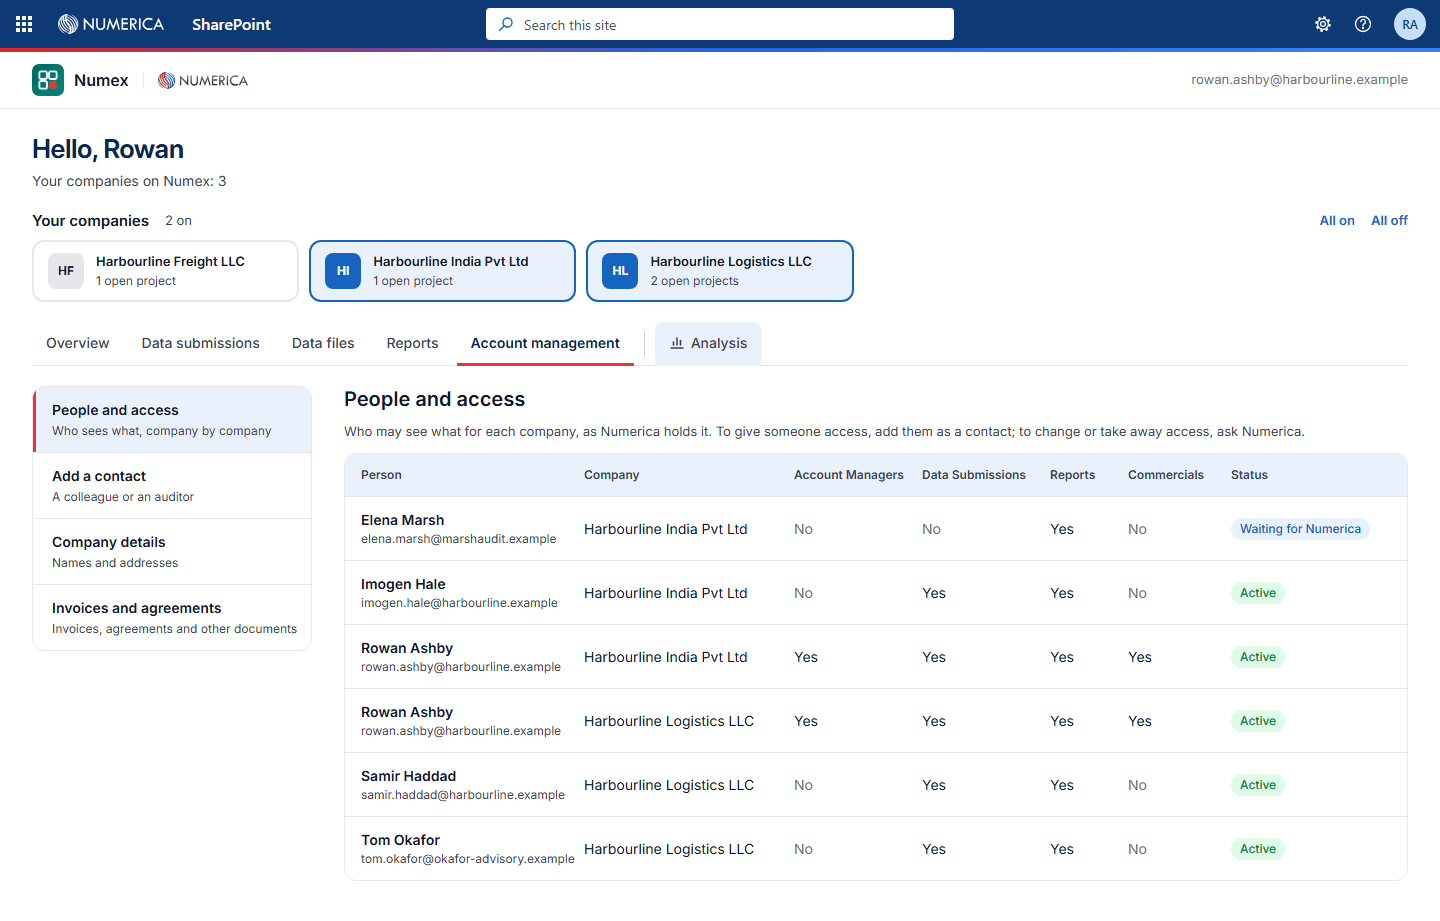
The "Account management" tab: see who has access to each company, from your colleagues to your auditors and consultants. 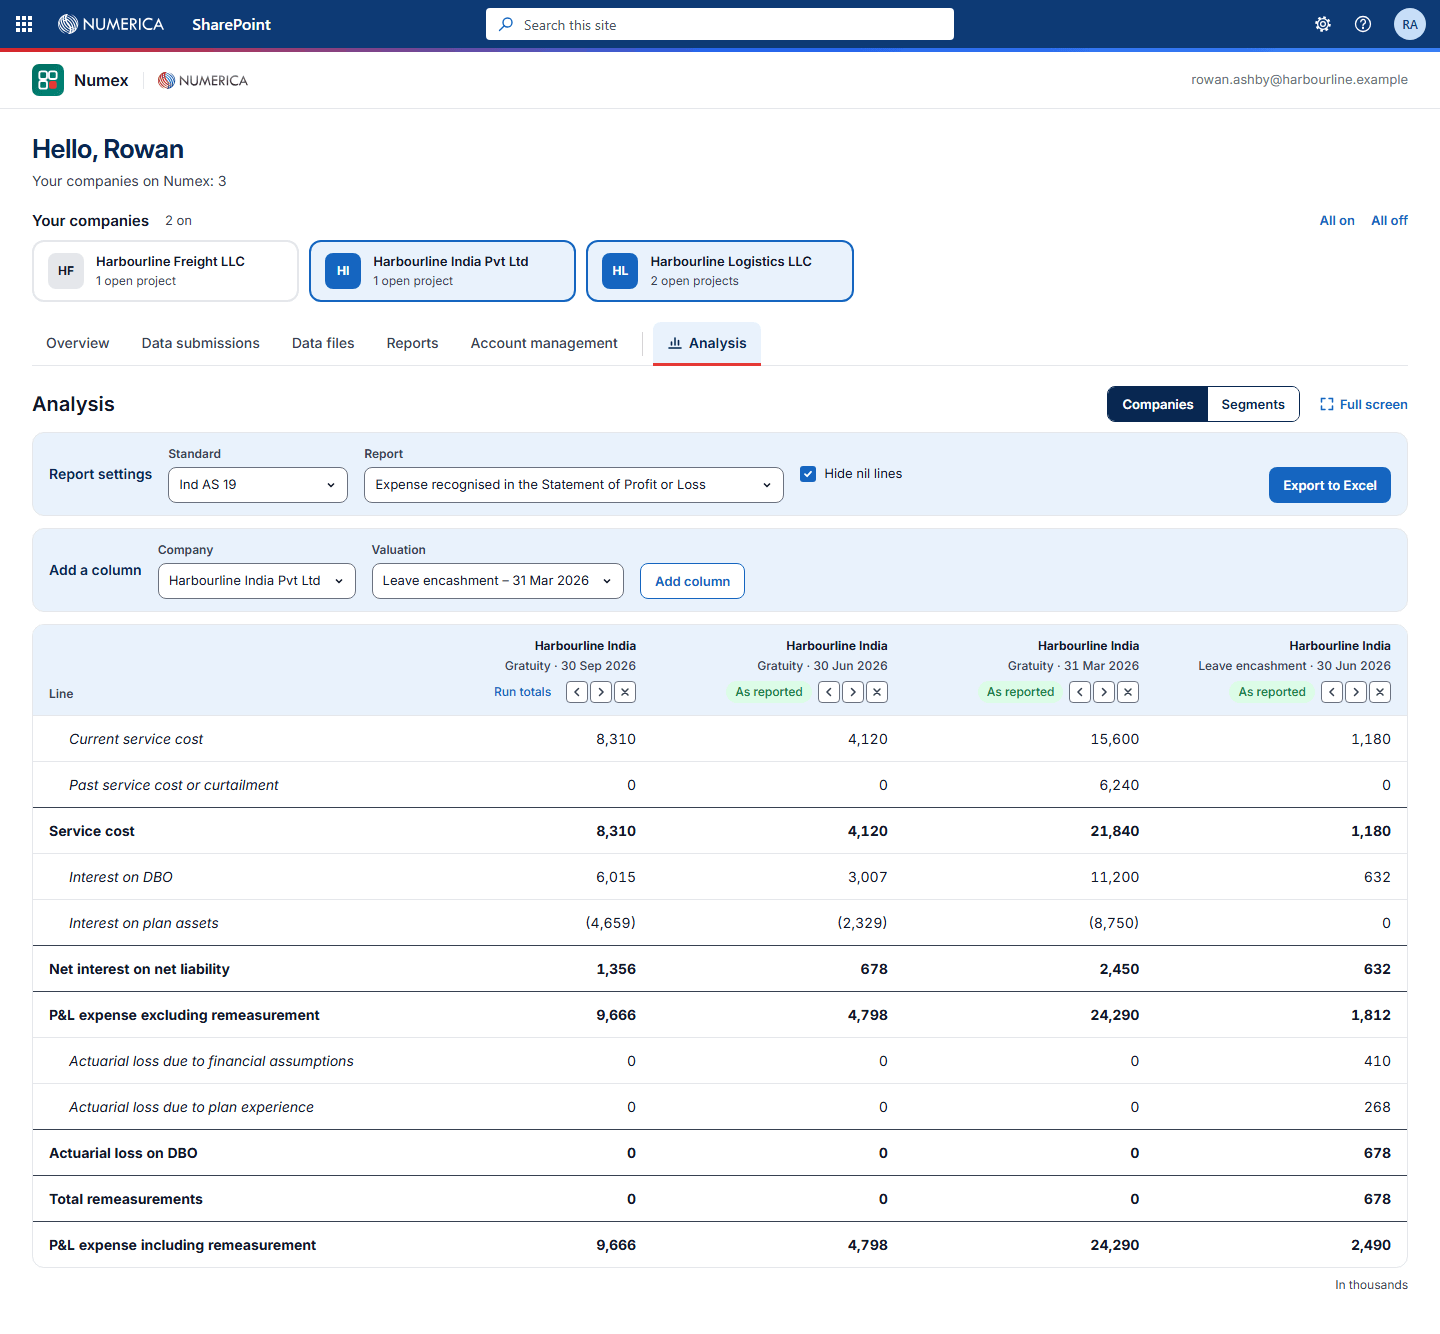
The "Analysis" tab: compare valuation results side by side, such as the expense in profit or loss, across periods, plans and companies or by segment, and export them to Excel.
What Numex gives your team
- All your companies on one page
- Every project's progress at a glance
- What we need from you, under "Waiting for data"
- Every file you have sent, searchable
- Your reports in one place, and by e-mail
- Results side by side, ready for Excel
- Direct access for your auditors and consultants too
How working with us through Numex goes
- Request a quoteTell us what you need and when, and get an instant quote*.
- Send your dataSelect "Send us your data" and choose the form for defined benefit or share-based payment plans. Your submission then appears in Numex.
- Follow the workEach project's step bar and status show where it stands. "Waiting for data" means we need something from you.
- Receive your reportsWe e-mail each report to you, and it is kept on the "Reports" tab in Numex with your others.
*In most cases.
Questions about Numex
Who can use Numex?
Anyone you choose: colleagues in finance or HR, and people outside your organisation too, such as your auditors and external consultants, so they can see your data and reports directly. Ask for their access under "Account management", or ask us, and each person sees only the companies you choose.
Who can see our data?
Only the people with access to your companies. Each person signs in with the work e-mail address we invited and sees only the companies their access covers. You choose who has access, and our team sets it up.
Do we need to install anything?
No. Numex is built on Microsoft 365 (SharePoint): you open it in your web browser and sign in with your work e-mail address.
We have several companies. Can we see them together?
Yes. Numex shows a tile for each of your companies; switch them on or off and every tab shows the ones that are on. Under "Analysis" you can set their results side by side, or split one valuation by segment, such as location or grade. If you need results for the whole group, our team prepares them on request.
Already a client?
How to use Numex
Following your projects
When you sign in, you land on the Numex home page. Above its tabs is a row of tiles, one for each of your companies: switch a tile on or off to choose which companies the tabs show. You see only the companies your access covers.
The "Overview" tab opens first. Under "Projects" you will find your projects, newest first. Each one has a step bar showing how far it has got, its current status and when it was last updated. To narrow the list, use the filters "In progress", "Waiting for data" and "Completed". "Waiting for data" shows the projects where we need something from you, including any data we have sent back to be resubmitted.
The tab also has our newest articles from this website and "Quick links".
Sending us your data
To start a new submission, select "Send us your data" on the "Overview" tab. It opens our submit data page on this website, where you choose the form for defined benefit plans or the one for share-based payment plans.
Once you have sent it, your submission appears under "Projects" and on the "Data submissions" tab, where you can follow it.
Finding the data you have sent
The "Data submissions" tab lists your entries for every company you have switched on in the tiles above. Select an entry's files to see the data files on it. You see the current set: if you have sent a file more than once, the newest version is the one shown.
The "Data files" tab lists every data file you have sent, newest first, with its company and the data submission it came with. Use "Search these files" to find one by name; files open in your browser.
Getting your reports
We e-mail each report to you. Your reports are also on the "Reports" tab, newest first, for every company you have switched on, each with its plan, standard, period end and status. Use "Search these files" to find one; reports open in your browser.
Comparing your results
The "Analysis" tab sets your valuation results side by side. Under "Report settings", choose the "Standard" and the "Report", such as the liability recognised in the statement of financial position, the reconciliation of the defined benefit obligation, the actuarial assumptions or the sensitivity analysis.
- "Companies" compares valuations: under "Add a column", pick a company and a valuation, up to eight columns. Each column says whether its figures are "As reported", from the final report, or "Run totals", before the final report.
- "Segments" splits one valuation by one or two of its tags, such as location or grade, with a total.
Tick "Hide nil lines" to leave out empty lines, and select "Export to Excel" to take the table with you.
Managing your account
The "Account management" tab is where you manage who sees what, and keep your company's records:
- "People and access" shows who sees what, company by company;
- "Add a contact" asks us to give a colleague, your auditor or an external consultant access to the companies you choose;
- "Company details" shows the names and addresses we hold for your company;
- "Invoices and agreements" keeps your invoices, agreements and other documents.
Need a hand?
Some tasks are done for you by our team, such as preparing your results for the whole group, across your companies. For these or anything else, contact us.
Want Numex for your next valuation?
Tell us what you need and when, and get an instant quote.*
*In most cases.