
Discount Rates in India
The chart shows Numerica’s zero-coupon discount rate curve for India: annually compounded spot rates by maturity, constructed each trading day from Government of India securities traded on the Clearing Corporation of India’s NDS-OM platform. Hover over the curve for the rate at any maturity, and over a point for the bond behind it. Earlier days can be selected from the date picker.
Numerica’s constructed curve is published daily from 28 September 2026. Curves for dates before then are the Zero Coupon Yield Curve published by CCIL, which this page displayed until that date. CCIL’s published curve, and the zero curve published by Financial Benchmarks India (FBIL), are used as independent checks on each day’s constructed curve.
Methodology
Data Collection: Outright trades in Government of India dated securities and treasury bills on CCIL’s NDS-OM platform, taken at 5:30 PM IST on each trading day, together with the Reserve Bank of India’s policy repo rate.
Data Filtering: Fixed-coupon dated Government of India securities and treasury bills are used. Bills maturing within about 36 days, floating-rate bonds, state development loans and special securities are excluded, and a traded yield that sits off the day’s term structure is down-weighted before fitting.
Historical Aggregation: When fewer than 3 bonds trade on a given day, we aggregate trades from up to 7 prior days (unique securities only) to ensure adequate data points for curve fitting.
Curve Fitting: Nelson-Siegel parametric model with volume-weighted fitting. Securities are weighted by the square root of their relative trading volume, cash flows follow the G-Sec convention of semi-annual coupons on a 30/360 basis, treasury bills set the short end, and the RBI policy repo rate is a light guard rail at the overnight tenor.
Temporal Smoothing: Alpha (confidence score) ranges from 0.0 to 1.0 based on: bond count (20%), volume (50%), liquidity (15%), fit quality (10%) and maturity coverage (5%). Smoothed curve = α × today’s curve + (1-α) × previous curve. On a day with 20 or more securities traded the day’s fit is used as it is, unsmoothed.
Reference Check: Each day’s curve is compared with the zero-coupon curves published by CCIL and FBIL for the same date, restated to annual compounding. A curve that departs from both published curves beyond tolerance (25 basis points root mean square, or 50 at any maturity), where those two agree with each other, is replaced on this page by CCIL’s published curve until it has been reviewed.
Full technical documentation →
Appropriate Use
Follow judgement:
- IAS 19, Ind AS 19, AS 15 discount rate determination for employee benefit obligations
- IFRS/Ind AS compliance and financial reporting
- Actuarial valuations requiring INR-denominated discount rates
- Benchmarking and economic analysis
Not Appropriate For
Any other purpose not listed above, including:
- Trading, investment decisions, or portfolio management
- Pricing derivatives or structured products
- High-frequency or intraday applications
- Regulatory capital calculations requiring approved vendor data
Disclaimers
Intended users: This data is provided exclusively for Numerica clients and their professional advisors working on Ind AS 19, IAS 19, AS 15 and other IFRS and Indian GAAP compliance matters.
No warranty: No representations or warranties regarding accuracy, completeness, or timeliness. Yield curves are fitted models; thin trading may affect reliability.
Professional judgment required: Users must exercise independent professional judgment and verify data before use in financial reporting. Ultimate responsibility for discount rate selection rests with the reporting entity and their auditors.
No liability: Numerica shall not be liable for losses, damages, or adverse consequences arising from use of this data.
INR Discount Rates at vs 31 March 2026
Published
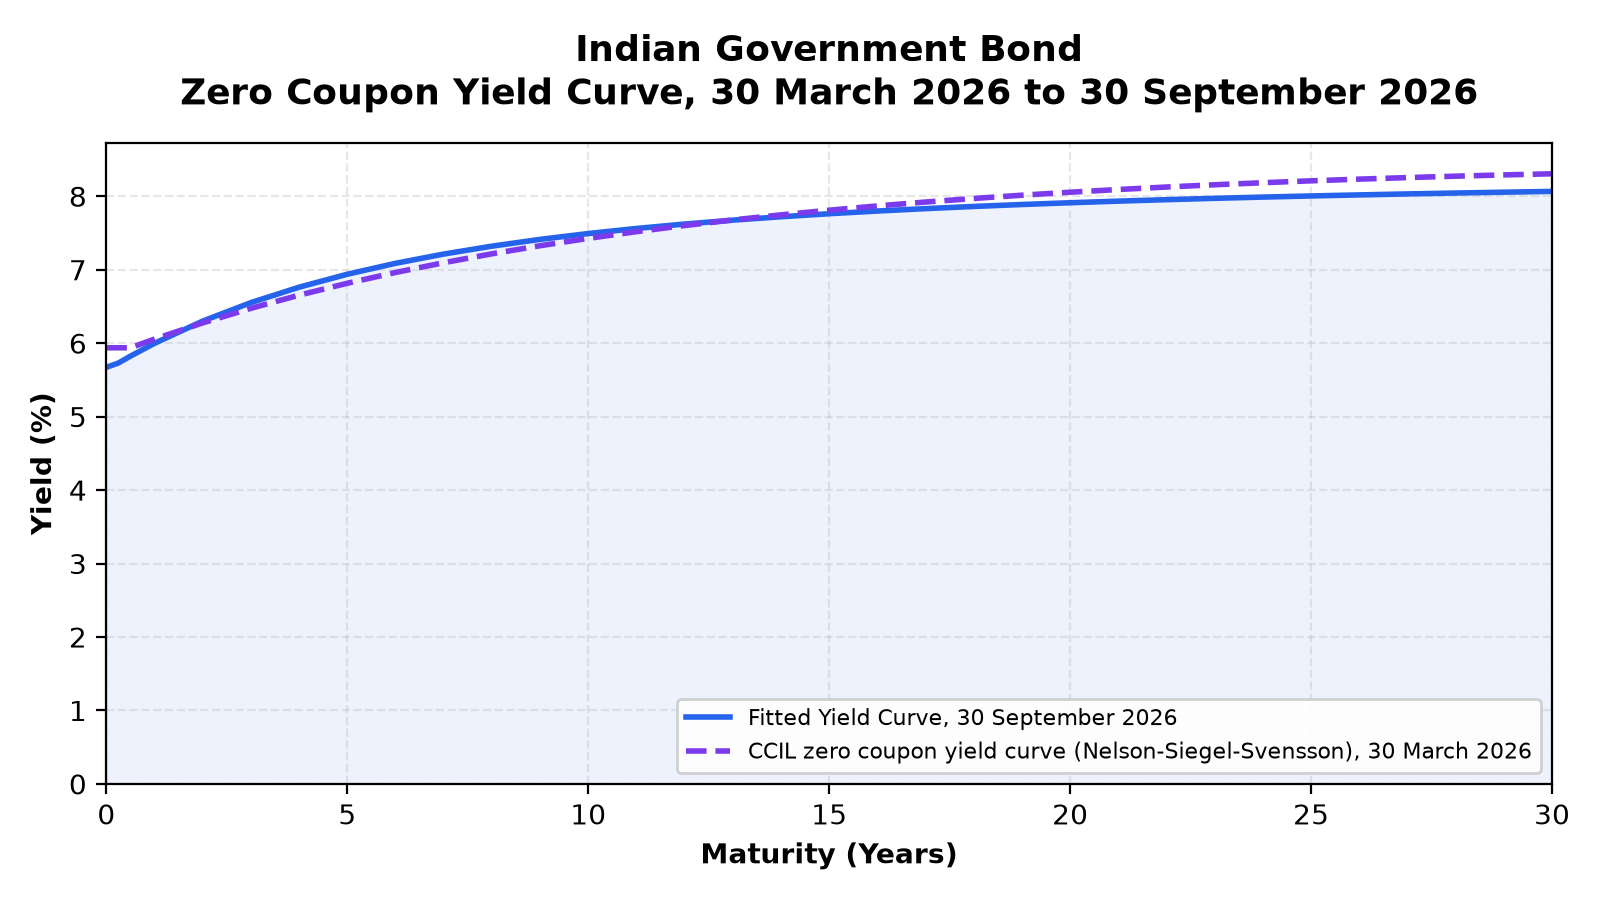
INR discount rates were little changed on average between 31 March 2026 and 30 September 2026, with the 10-year rate moving from 7.43% to 7.49% (+7 basis points). A higher 10-year rate means indicatively about a 1% decrease in gratuity and leave liabilities at a 10-year duration.
Key Takeaways
- 10-year rate: moved from 7.43% to 7.49% (+7 basis points) since 31 March 2026.
- Short end: the 1-year rate fell 6 basis points and the 2-year rate rose 2 basis points.
- Long end: rates fell 5 basis points at 15 years, 14 at 20 years and 24 at 30 years.
- Slope: the 10-year less 2-year slope went from 1.15% to 1.19% (+4 basis points); the curve kept its shape.
- Liabilities: indicatively about a 1% decrease at 8-year and 10-year durations, and about a 1% increase at 15 years.
1. What Changed Since 31 March 2026
| Term (Years) | 31 March 2026 | 30 September 2026 | Change (bps) |
|---|---|---|---|
| 1 | 6.06% | 6.00% | -6 |
| 2 | 6.28% | 6.30% | +2 |
| 3 | 6.47% | 6.55% | +8 |
| 5 | 6.82% | 6.94% | +12 |
| 7 | 7.10% | 7.21% | +12 |
| 10 | 7.43% | 7.49% | +7 |
| 15 | 7.81% | 7.76% | -5 |
| 20 | 8.05% | 7.91% | -14 |
| 30 | 8.31% | 8.07% | -24 |
Changes are calculated from unrounded rates. See our disclaimer.
Level. The average change across tenors was -1 basis point: the curve was little changed. Rates rose from 2 to 10 years and fell at 1 year and from 15 years. Across the 1-year to 30-year terms, the curves cross between the 1-year and 2-year points and again between the 10-year and 15-year points. The 31 March 2026 rates are from CCIL’s Zero Coupon Yield Curve and the 30 September 2026 rates from Numerica’s constructed curve.
Short end. The 1-year rate moved from 6.06% to 6.00% (-6 basis points) and the 2-year from 6.28% to 6.30% (+2 basis points).
Long end. The 15-year rate moved from 7.81% to 7.76% (-5 basis points), the 20-year from 8.05% to 7.91% (-14 basis points) and the 30-year from 8.31% to 8.07% (-24 basis points).
Slope. The 10-year less 2-year slope went from 1.15% at 31 March 2026 to 1.19% at 30 September 2026 (+4 basis points): the curve kept its shape.
Since 30 June 2026. Over the quarter, from CCIL’s Zero Coupon Yield Curve at 30 June 2026 to Numerica’s constructed curve at 30 September 2026, rates rose at every term. The 10-year rate moved from 7.05% to 7.49% (+44 basis points), and the 10-year less 2-year slope from 1.03% to 1.19% (+16 basis points): the curve steepened.
2. Impact on Gratuity and Leave Liabilities
Ind AS 19 and AS 15 valuations discount future benefit payments on a government bond curve such as this one. The rate is read at the liability’s duration, typically 8 to 15 years for gratuity and 5 to 10 years for leave encashment.
Higher discount rates reduce the present value of these liabilities and lower rates increase it. Since 31 March 2026 the rate rose at durations of 5 to 12 years and fell at 15 years, so the effect depends on duration, other things being equal.
| Duration (Years) | Rate Change (bps) | Indicative Liability Impact |
|---|---|---|
| 5 | +12 | 0% to 1% decrease |
| 8 | +10 | About 1% decrease |
| 10 | +7 | About 1% decrease |
| 12 | +2 | No material change |
| 15 | -5 | About 1% increase |
Indicative only: the figures above are first order and reflect only the rate change at each duration. The actual impact depends on your workforce profile and plan design, and your actuary computes it in the valuation.
Where the change is recognised. Under Ind AS 19, remeasurements of post-employment benefits such as gratuity are recognised in other comprehensive income (OCI). Under AS 15, actuarial gains and losses are recognised in profit and loss. Leave encashment is generally an other long-term employee benefit, so its actuarial gains and losses go to profit or loss under both standards.
Need an actuarial valuation? We prepare Ind AS 19 and AS 15 valuations of gratuity and leave encashment; contact us to discuss your next valuation.
For finance teams, auditors and actuaries preparing Ind AS 19 and AS 15 gratuity and leave encashment valuations.
How Numerica constructs its curve, and when CCIL’s curve is shown instead →