- Long-term INR government bond yields rose 60-90 bps between March 2025 and March 2026
- The yield curve steepened — short-term rates fell while long-term rates climbed
- The discount rate at 31 Mar 2026 is likely to be higher than 31 Mar 2025
- Higher discount rates mean lower actuarial liabilities for gratuity and leave encashment
- Most companies can expect a 5-8% reduction in defined benefit obligations
Table of Contents
- Yield Curve Comparison: March 2025 vs March 2026
- What Changed and Why
- Impact on Gratuity and Leave Liabilities
- Action Items for Finance Teams
- FAQs
1. Yield Curve Comparison: March 2025 vs March 2026
The table below shows the CCIL zero-coupon INR government bond yields at key maturities. These are the rates used to derive the discount rate at 31 March 2026 for Ind AS 19 and AS 15 valuations.
| Term (Years) | 31 March 2025 | 31 March 2026 | Change (bps) |
|---|---|---|---|
| 1 | 6.39% | 5.88% | -51 |
| 5 | 6.37% | 6.59% | +22 |
| 10 | 6.55% | 7.16% | +61 |
| 15 | 6.72% | 7.52% | +80 |
| 20 | 6.83% | 7.75% | +92 |
Source: CCIL (Clearing Corporation of India Limited). Actual dates are 28 March 2025 and 30 March 2026 — the last trading days before the respective year-ends.
Yield Curve Chart
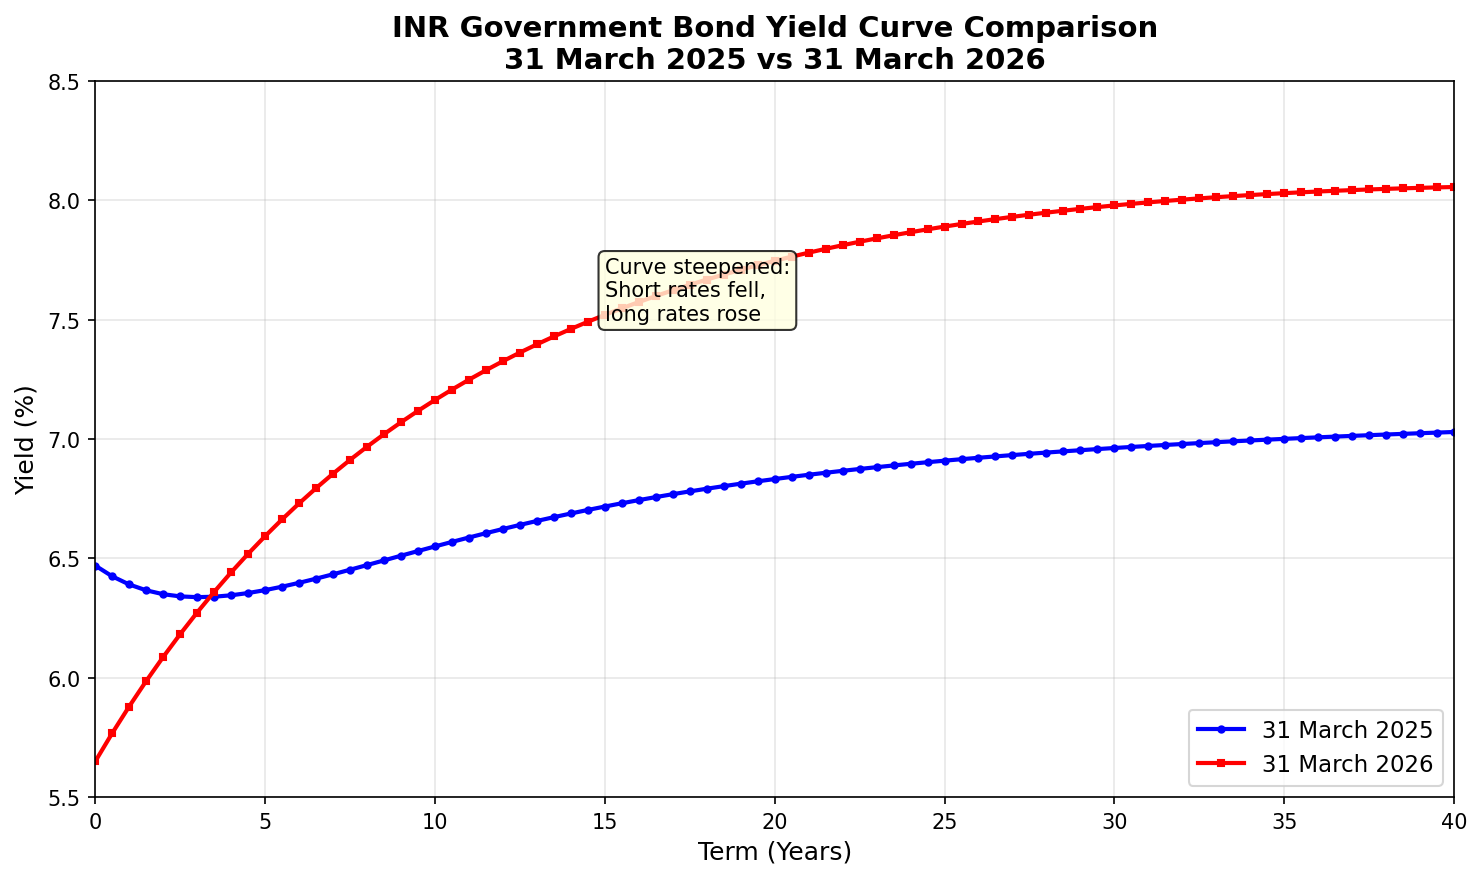
The visual tells the story: the curve has steepened dramatically. Short-term rates dropped as the RBI cut the repo rate, but long-term rates moved in the opposite direction.
2. What Changed and Why
The Bear Steepening Phenomenon
Normally, when the RBI cuts rates, bond yields fall across the curve. In 2025-26, we saw something different: a bear steepening. Short-term yields followed the policy rate down, but long-term yields rose.
Key Drivers
RBI Rate Cuts: The RBI cut the repo rate by 125 basis points during 2025, bringing it down from 6.50% in January to 5.25% by December 2025. This pulled down the short end of the curve.
Supply-Demand Imbalance: Heavy issuance of long-dated government securities (G-Secs) and state development loans (SDLs) put upward pressure on long-term yields. Demand from traditional buyers — banks, insurers, pension funds — has not kept pace with supply.
Fiscal Concerns: While the fiscal deficit improved to 4.8% of GDP in FY25, the overall debt supply remains elevated. The market is pricing in sustained borrowing.
Global Factors: Rupee volatility, elevated crude oil prices, and uncertainty around trade policy have added a risk premium to long-term bonds.
Inflation Expectations: Despite current inflation running low (below 2% in late 2025), markets remain cautious about medium-term inflation risks, particularly from oil and currency depreciation.
3. Impact on Gratuity and Leave Liabilities
The Discount Rate at 31 Mar 2026 under Ind AS 19 and AS 15
Both Ind AS 19 and AS 15 require employee benefit liabilities to be discounted using yields on high-quality corporate bonds, or in their absence, government bond yields. In India, the market convention is to use the CCIL zero-coupon government bond curve.
The discount rate should match the duration of the benefit obligation — typically 8-15 years for gratuity and 5-10 years for leave encashment, depending on workforce demographics.
Expected Impact on Liabilities
Higher discount rates reduce the present value of future benefit payments. Here’s a rough guide:
| Duration | Rate Change | Estimated Liability Impact |
|---|---|---|
| 8 years | +50 bps | ~4% decrease |
| 10 years | +60 bps | ~5-6% decrease |
| 12 years | +75 bps | ~7-8% decrease |
| 15 years | +80 bps | ~9-10% decrease |
What This Means in Practice
For a company with ₹100 crore in gratuity liability at March 2025:
- With a 10-year duration and ~60 bps rate increase
- The liability could reduce by approximately ₹5-6 crore
- This gain flows through Other Comprehensive Income (OCI) under Ind AS 19. See our guide on actuarial gains and losses for more details.
For AS 15 reporters, the gain is recognised in the Statement of Profit and Loss.
4. Action Items for Finance Teams
| Action | Timeline | Responsible |
|---|---|---|
| Obtain updated discount rate from actuary | Before year-end close | Finance/Actuary |
| Review actuarial valuation assumptions | Within 2 weeks of year-end | Finance |
| Assess impact on P&L and OCI | During closing | Finance |
| Update disclosures for duration and rate sensitivity | Before signing financials | Finance |
| Communicate material changes to audit committee | Pre-audit | CFO |
5. FAQs
What discount rate should I use for 31 March 2026?
The rate depends on your liability duration. For a typical gratuity obligation with 10-12 year duration, rates are now in the 7.1-7.4% range, compared to 6.5-6.7% a year ago.
Why did long-term rates rise when the RBI was cutting?
This is bear steepening — a situation where short rates fall (following policy) but long rates rise due to supply pressures, fiscal concerns, and inflation expectations. The bond market is forward-looking and prices in risks the policy rate doesn’t capture.
Will this reduce my gratuity expense?
The liability reduction from a higher discount rate is recognised in OCI under Ind AS 19, not in P&L. Your service cost and interest cost calculations may still result in similar or higher P&L expense, depending on other factors. Under AS 15, all actuarial gains flow through P&L.
Should I change my salary growth assumption too?
The salary growth assumption should reflect your actual expected increases, not be mechanically linked to discount rates. However, if market-wide salary inflation is moderating, a review may be warranted. Discuss with your actuary.
Where can I get the official yield curve data?
CCIL publishes the INR zero-coupon yield curve daily on their website. FBIL (Financial Benchmarks India Limited) also provides benchmark rates. Your actuary should be using these official sources.
Numerica provides Ind AS 19 and AS 15 valuations for gratuity, leave encashment, and other employee benefits. Contact us for a quote.