Key Takeaways
- Yield curve range: 4.04% (6 months) to 6.21% (30 years) — a 217 basis point term premium
- 10-year rate: 5.54% — the most common benchmark for EOSB and insurance liabilities
- Trading volume: SAR 36.8 million across 6 Sukuk trades — highest of the week, up 483% from prior day
- YoY change: SAMA policy rates down 75 bps from December 2024; curve significantly steeper — short rates down ~87 bps, long rates flat to slightly higher
- Data quality: Smoothing alpha of 78.5% indicates high confidence in today’s curve
- Applicability: IAS 19 employee benefits, IFRS 17 insurance contracts, IFRS 9 expected credit losses
Contents
The Saudi Arabia discount rate as at December 31, 2025 reflects robust year-end trading activity, providing a reliable basis for financial reporting valuations. This update covers the smoothed government Sukuk yield curve used for IAS 19 employee benefit valuations, IFRS 17 insurance contract liabilities, and other SAR-denominated present value calculations.
For background on why a properly constructed SAR yield curve is essential — and why USD Treasuries or other shortcuts don’t work — see our comprehensive guide: Discount Rate in Saudi Arabia for EOSB Valuation Under IAS 19.
Disclaimer: For informational purposes only. Numerica is not liable for decisions based on this data. Professional judgement should be applied for specific valuations. Read our full legal disclaimer.
1. December 2025 Yield Curve
The smoothed yield curve for December 31, 2025 shows a normally upward-sloping term structure. The chart below compares the raw bootstrapped curve, the unsmoothed Nelson-Siegel fit, and the final smoothed curve:
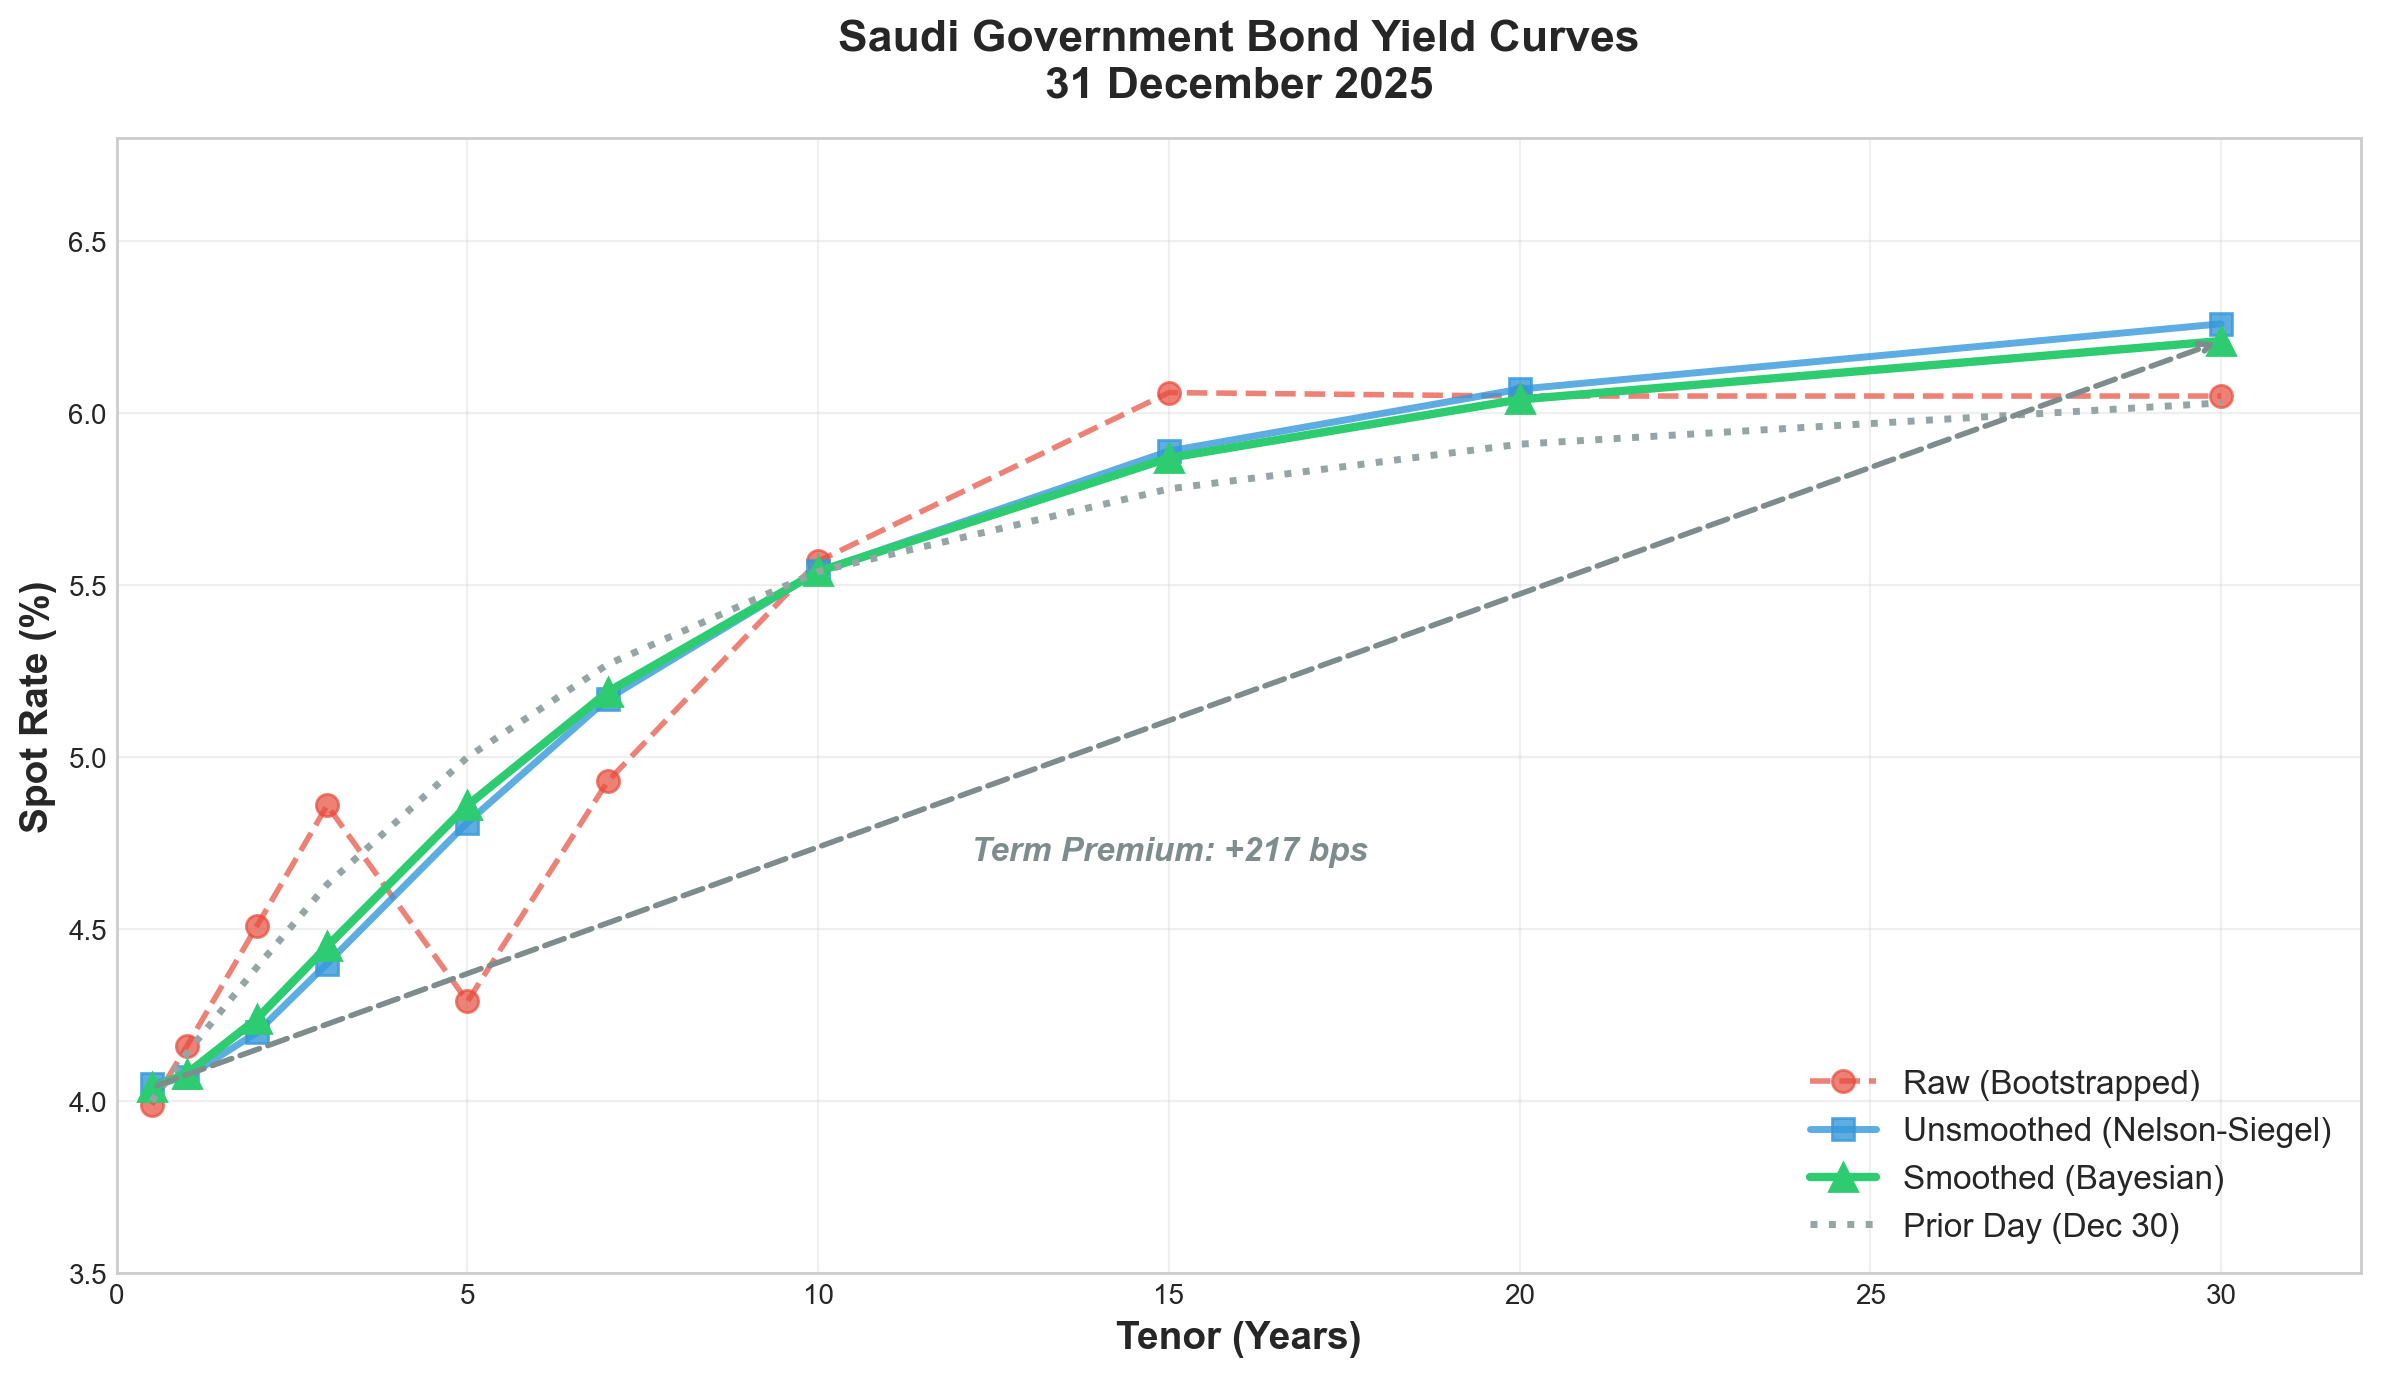
Figure 1: Raw vs Unsmoothed vs Smoothed yield curves as at 31 December 2025. The smoothed curve (green) applies Bayesian temporal averaging to reduce noise from daily trading fluctuations.
| Tenor | Raw Rate | Unsmoothed | Smoothed | Δ vs Dec 30 |
|---|---|---|---|---|
| 6 months | 3.99% | 4.05% | 4.04% | +4 bps |
| 1 year | 4.16% | 4.07% | 4.08% | -6 bps |
| 2 years | 4.51% | 4.20% | 4.24% | -15 bps |
| 3 years | 4.86% | 4.40% | 4.45% | -18 bps |
| 5 years | 4.29%* | 4.81% | 4.86% | -14 bps |
| 7 years | 4.93% | 5.17% | 5.19% | -8 bps |
| 10 years | 5.57% | 5.54% | 5.54% | 0 bps |
| 15 years | 6.06% | 5.89% | 5.87% | +9 bps |
| 20 years | 6.05% | 6.07% | 6.04% | +14 bps |
| 30 years | 6.05% | 6.26% | 6.21% | +18 bps |
*The raw 5-year rate (4.29%) reflects an outlier trade. The Nelson-Siegel fitting corrects this to 4.81%.
The 217 basis point term premium (6.21% minus 4.04%) over 30 years reflects compensation for duration risk.
2. Selecting the Right Rate
We recommend using the smoothed yield curve calculated above to use for IFRS reporting as it smoothens the impact coming from outliers. The full smooth yield curve is available for download here.
The appropriate discount rate depends on the duration of your liabilities, not a one-size-fits-all benchmark. You would need to calculate your specific liability-weighted average duration in order to pick up the appropriate discount rate from the yield curve for your End of Service Benefit (EOSB) valuations. For detailed guidance on how to select discount rate for IAS 19 actuarial valuations, see our detailed methodology documentation.
For IFRS 17 valuation and reporting, the entire yield curve is used for valuation of insurance liabilities. In many cases, a spread adjustment (e.g. Matching Adjustment in the UK), will need to be applied over and above the calculated yield curve.
3. Curve Construction Methodology
The yield curve is constructed using a three-step process designed for thinly-traded markets:
- Raw (Bootstrapped): Linear interpolation between traded yields, plus a soft anchor at the short end based on SAMA reverse repo rate (3.75% + 10bps spread)
- Unsmoothed (Nelson-Siegel): Parametric fit producing a smooth curve from today’s data points
- Smoothed (Bayesian): Combines today’s parameters with the prior day using the data-quality-weighted alpha
Nelson-Siegel Parameters (December 31, 2025)
| Parameter | Description | Unsmoothed | Smoothed |
|---|---|---|---|
| β₀ | Long-term rate level | 6.64% | 6.56% |
| β₁ | Slope (short-term deviation) | -2.54% | -2.51% |
| β₂ | Curvature (hump/trough) | -3.18% | -2.80% |
| λ | Decay rate | 1.97 | 1.97 |
Goodness of Fit
| Metric | Value | Interpretation |
|---|---|---|
| R² | 0.67 | ~67% of variance explained |
| RMSE | 38.9 bps | Average error ~39 bps |
The moderate R² is expected with an outlier present. The 5.5-year trade (4.13% vs 4.91% fitted) accounts for most of the fitting error.
For a full explanation of why this methodology is necessary for the Saudi market, see our detailed methodology documentation.
4. Trading Activity Analysis
December 31, 2025 saw the highest trading volume of the week, with SAR 36.8 million across six Sukuk trades:
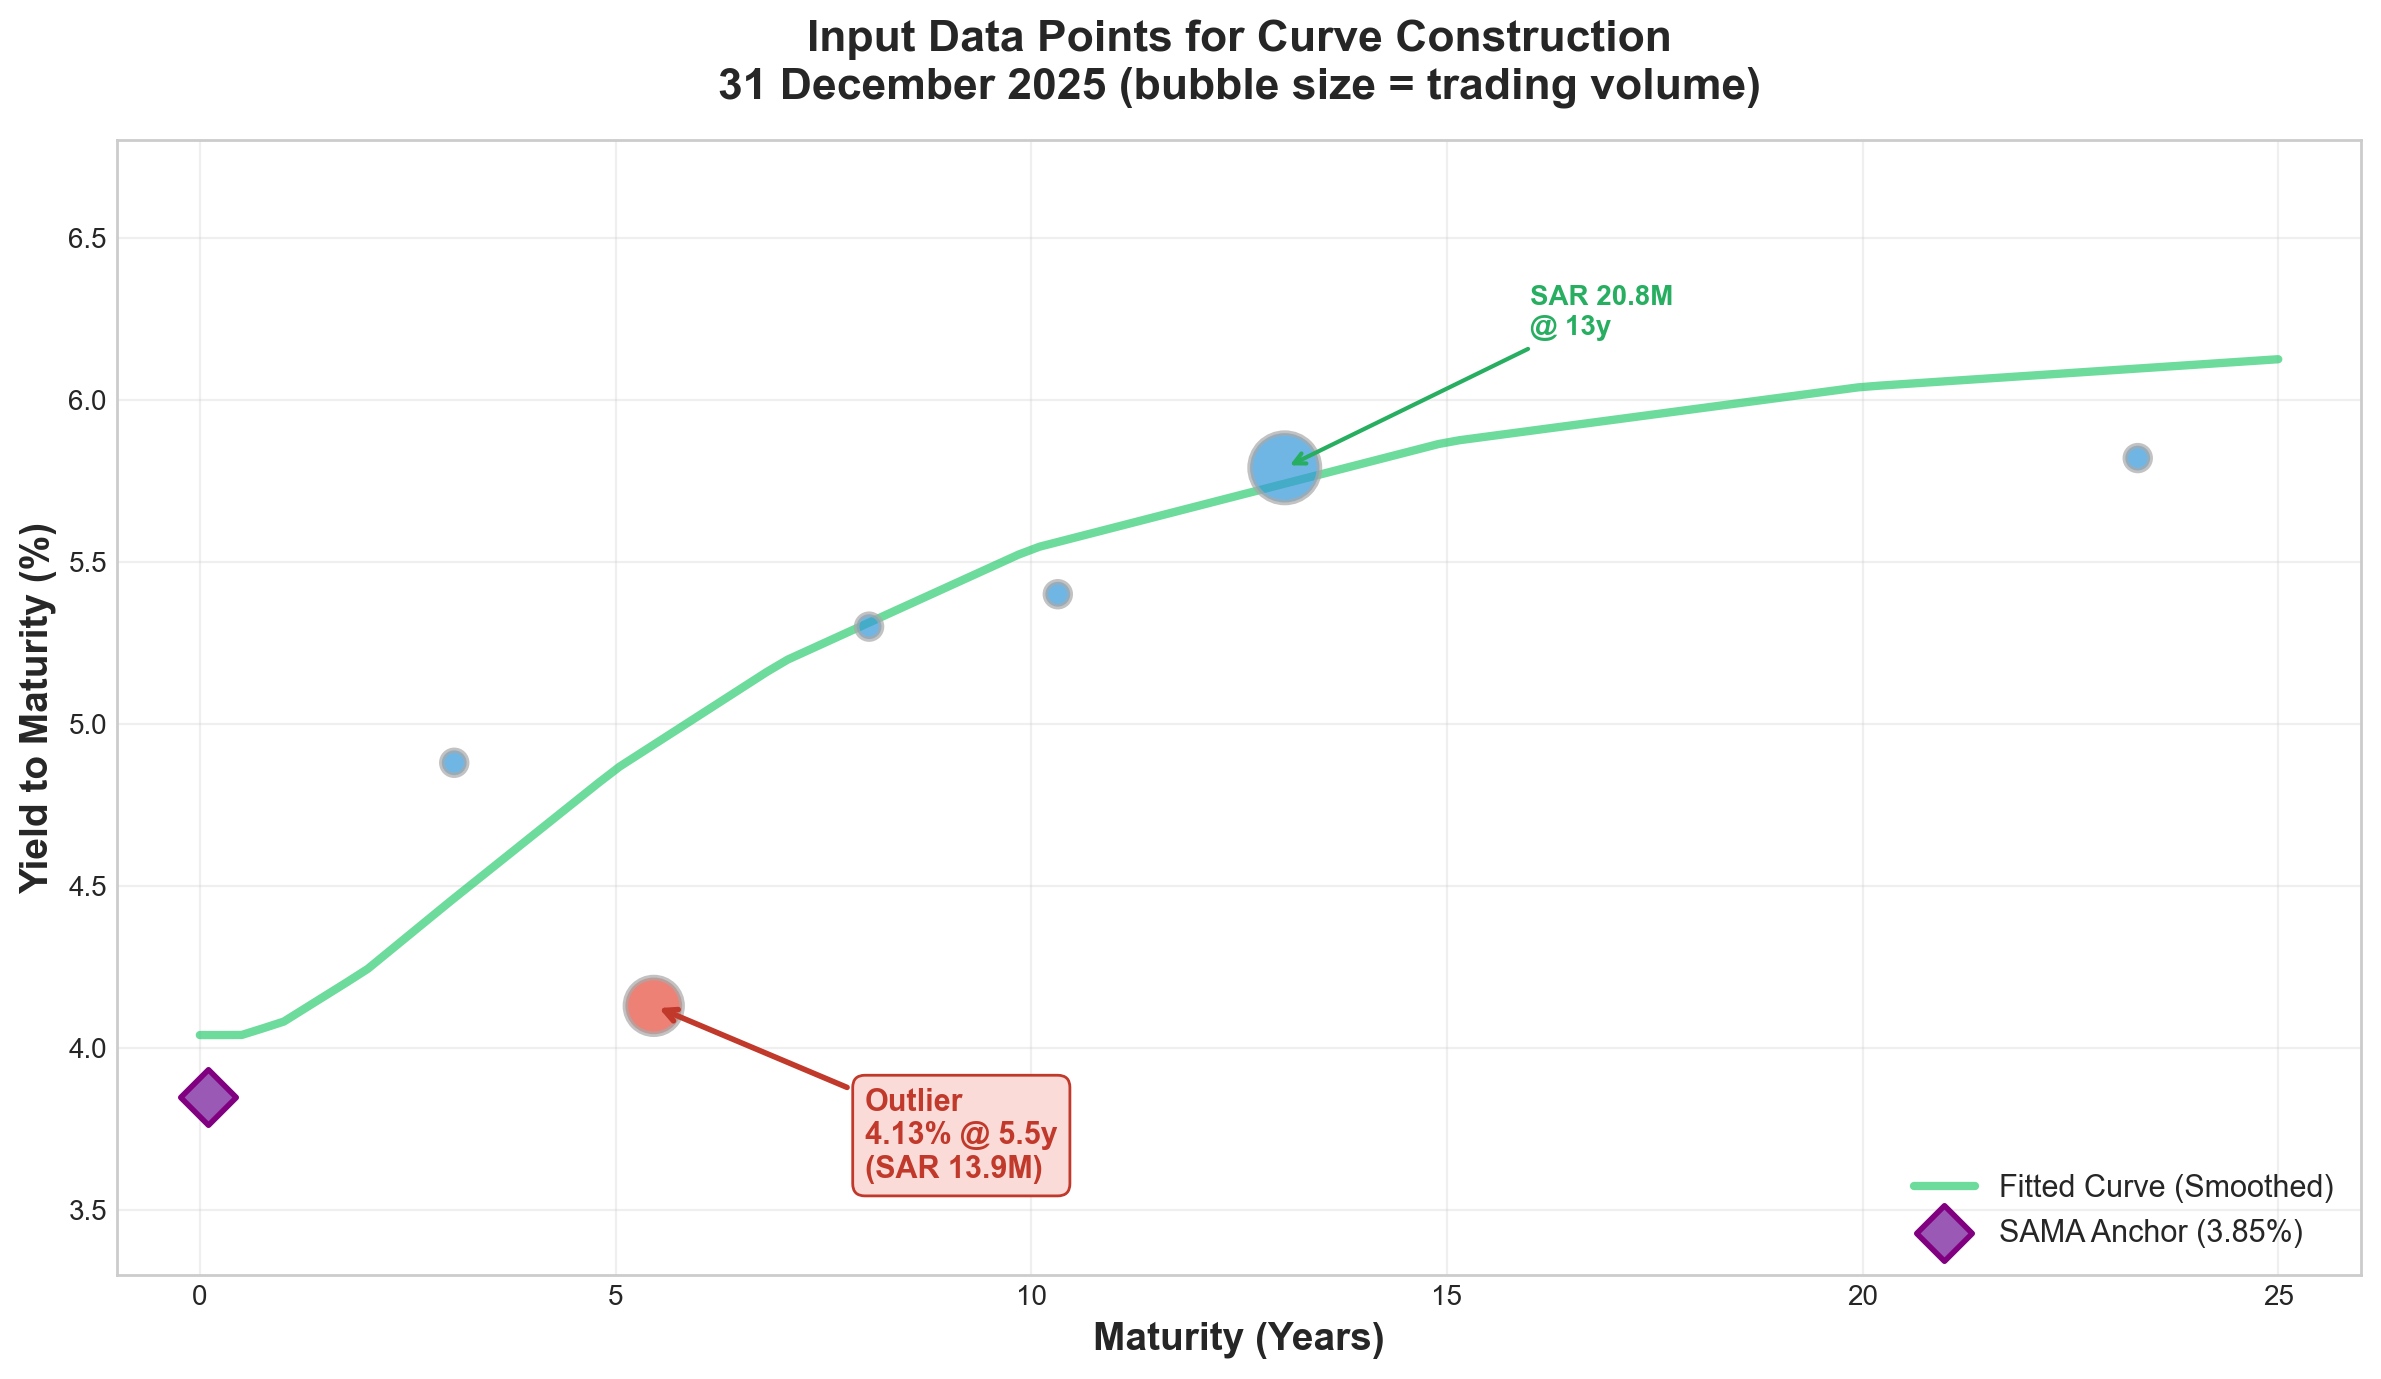
Figure 2: Traded Sukuk yields vs fitted curve. The 5.5-year outlier (circled) traded 78 bps below its fitted value.
| Sukuk | Maturity | YTM | Volume (SAR) | % of Total |
|---|---|---|---|---|
| KSA Sukuk 2024-01-15 | 13.1y | 5.79% | 20,801,185 | 56.5% |
| KSA Sukuk 2021-06-10 | 5.5y | 4.13%* | 13,890,000 | 37.7% |
| KSA Sukuk 2024-01-10 | 8.1y | 5.30% | 1,030,763 | 2.8% |
| KSA Sukuk 2024-04-12 | 10.3y | 5.40% | 1,016,190 | 2.8% |
| KSA Sukuk 2019-01-10 | 3.1y | 4.88% | 97,248 | 0.3% |
| KSA Sukuk 2019-04-30 | 23.3y | 5.82% | 850 | 0.0% |
| Total | 36,836,235 | 100% | ||
*Outlier: trading 78 bps below fitted curve (4.13% actual vs 4.91% fitted).
Observations
- Maturity coverage: 3.1 to 23.3 years — a 20-year range
- Volume concentration: Two trades (13y and 5.5y) account for 94% of volume
- Long-end liquidity: Thin — only SAR 850 traded beyond 15 years
- Year-end surge: Volume up 483% vs December 30 (SAR 36.8M vs SAR 6.3M)
5. Data Quality Assessment
The smoothing methodology uses a data-quality-weighted alpha (α) to determine how much to trust today’s trading data versus the prior day’s curve. December 31’s alpha of 78.5% is the highest of the week, reflecting strong year-end trading activity.
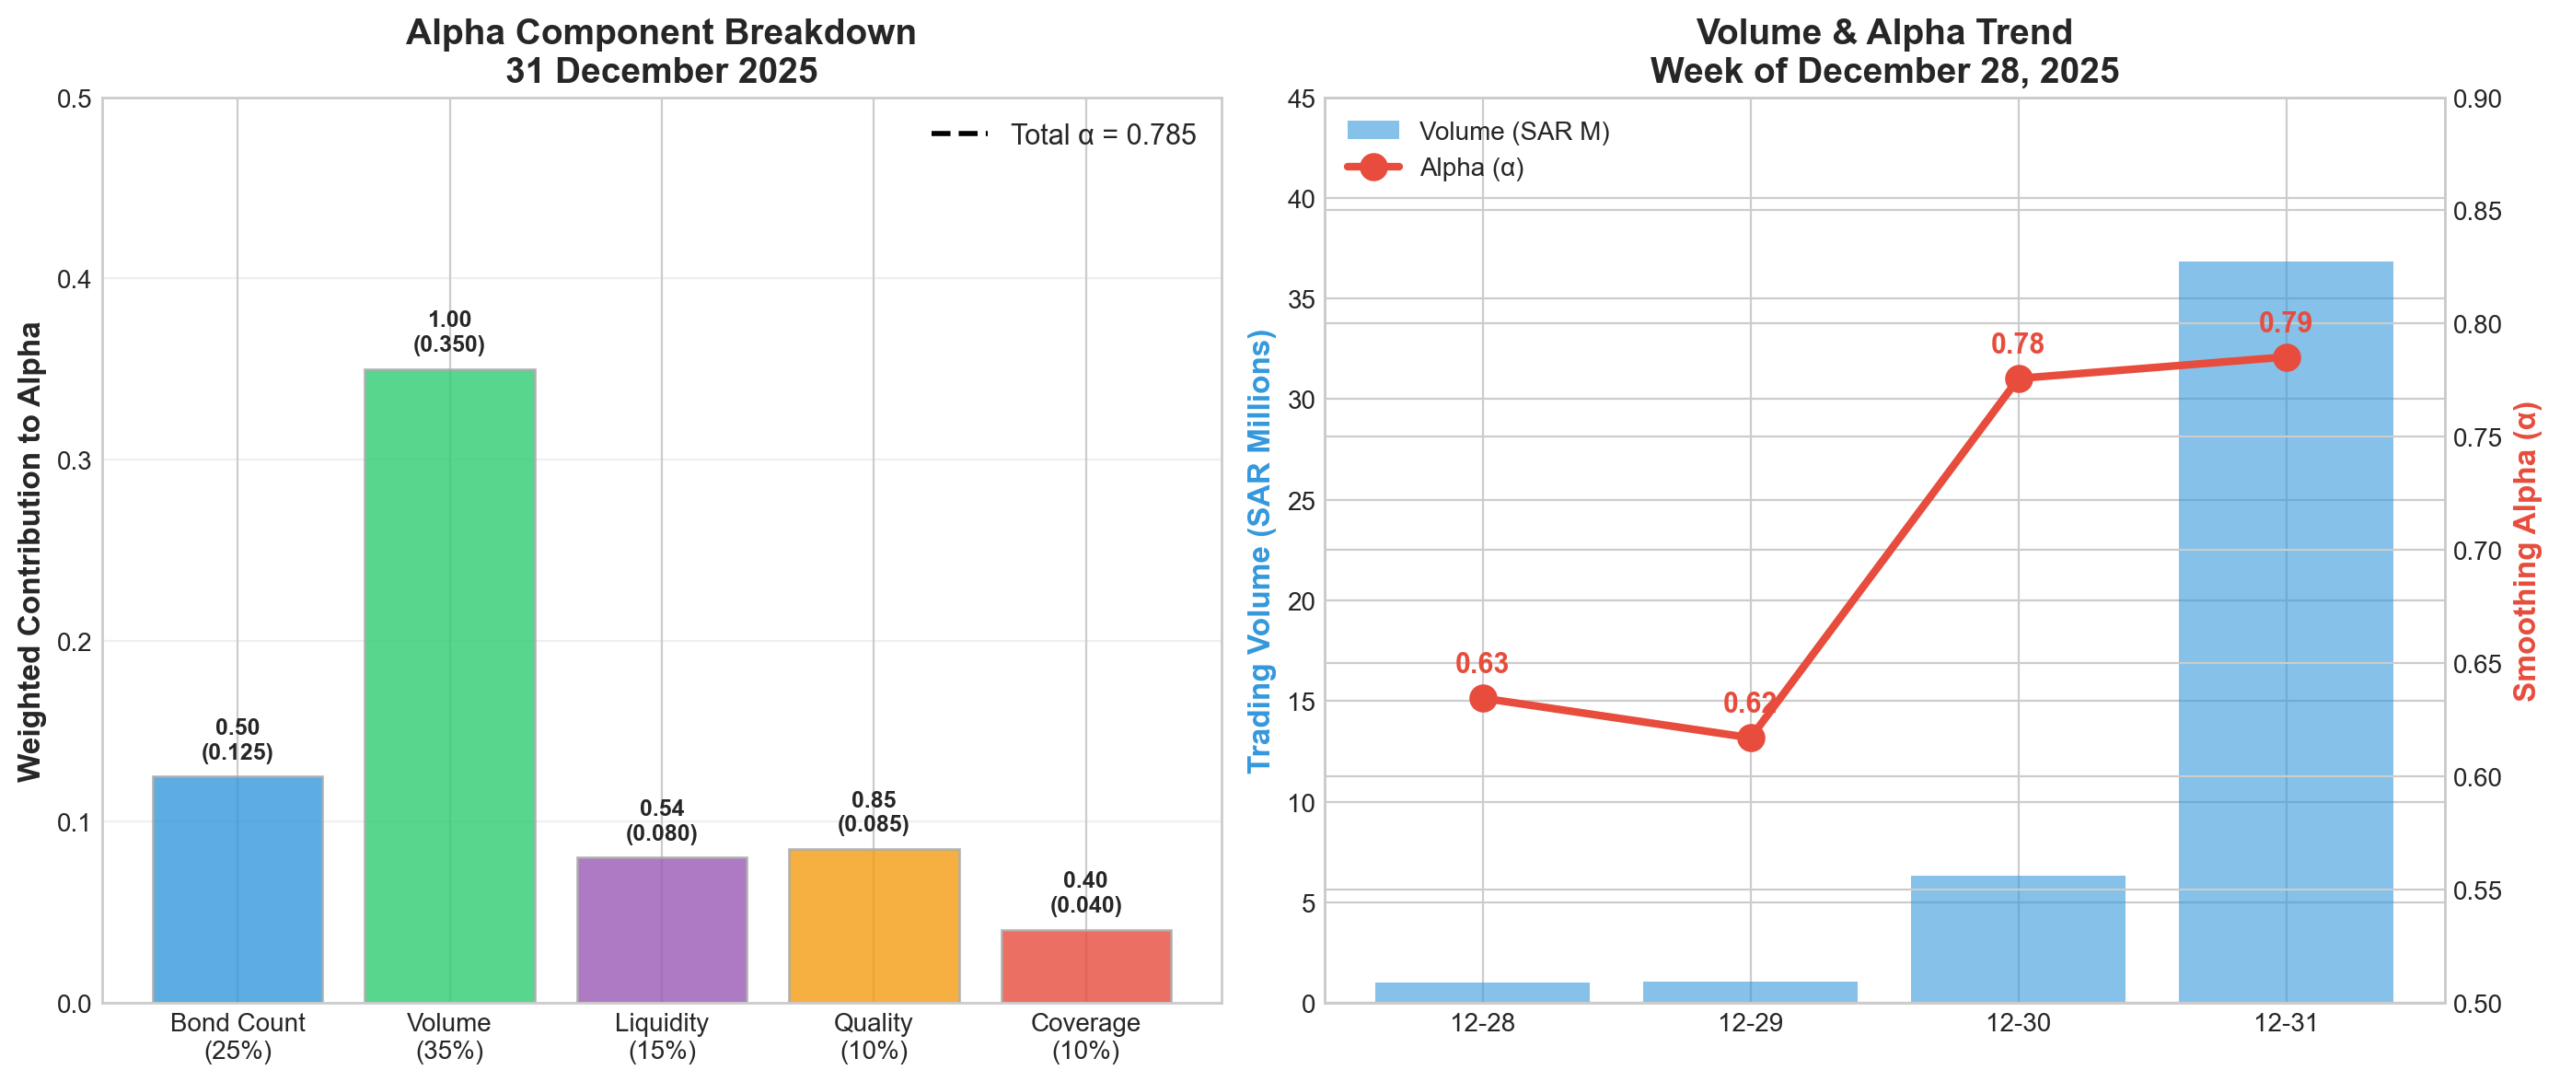
Figure 3: Trading activity and smoothing alpha comparison for December 28-31, 2025.
Four-Day Comparison: December 28-31
| Date | Trades | Volume (SAR) | Alpha (α) | Interpretation |
|---|---|---|---|---|
| Dec 28 | 4 | 993,670 | 63.5% | Moderate confidence |
| Dec 29 | 3 | 1,081,790 | 61.7% | Lowest of week |
| Dec 30 | 6 | 6,319,907 | 77.6% | Improved activity |
| Dec 31 | 6 | 36,836,235 | 78.5% | Highest confidence |
Alpha Component Breakdown
The smoothing alpha is calculated from five quality metrics, each weighted by importance:

Figure 4: Alpha component scores for December 31, 2025. Volume (1.00) and data quality (0.85) drive the high overall alpha.
| Metric | Weight | Score | Contribution | Interpretation |
|---|---|---|---|---|
| Trading Volume | 35% | 1.00 | 0.350 | Maximum score — SAR 36.8M exceeds threshold |
| Bond Count | 25% | 0.50 | 0.125 | 6 trades (at threshold) |
| Data Quality | 10% | 0.85 | 0.085 | High quality observations |
| Liquidity | 15% | 0.54 | 0.080 | Moderate bid-ask spreads |
| Tenor Coverage | 10% | 0.40 | 0.040 | 40% of range covered |
| Weighted Total → Smoothing Alpha | 0.785 | 78.5% | ||
The high alpha is driven primarily by the maximum volume score (1.00) and high data quality (0.85). This means December 31’s curve closely reflects actual market prices with minimal historical smoothing.
6. Year-over-Year Comparison
Comparing December 2025 to December 2024, SAMA policy rates have decreased by 75 basis points, consistent with the Saudi Arabian Monetary Authority following Federal Reserve rate cuts to maintain the SAR-USD peg.
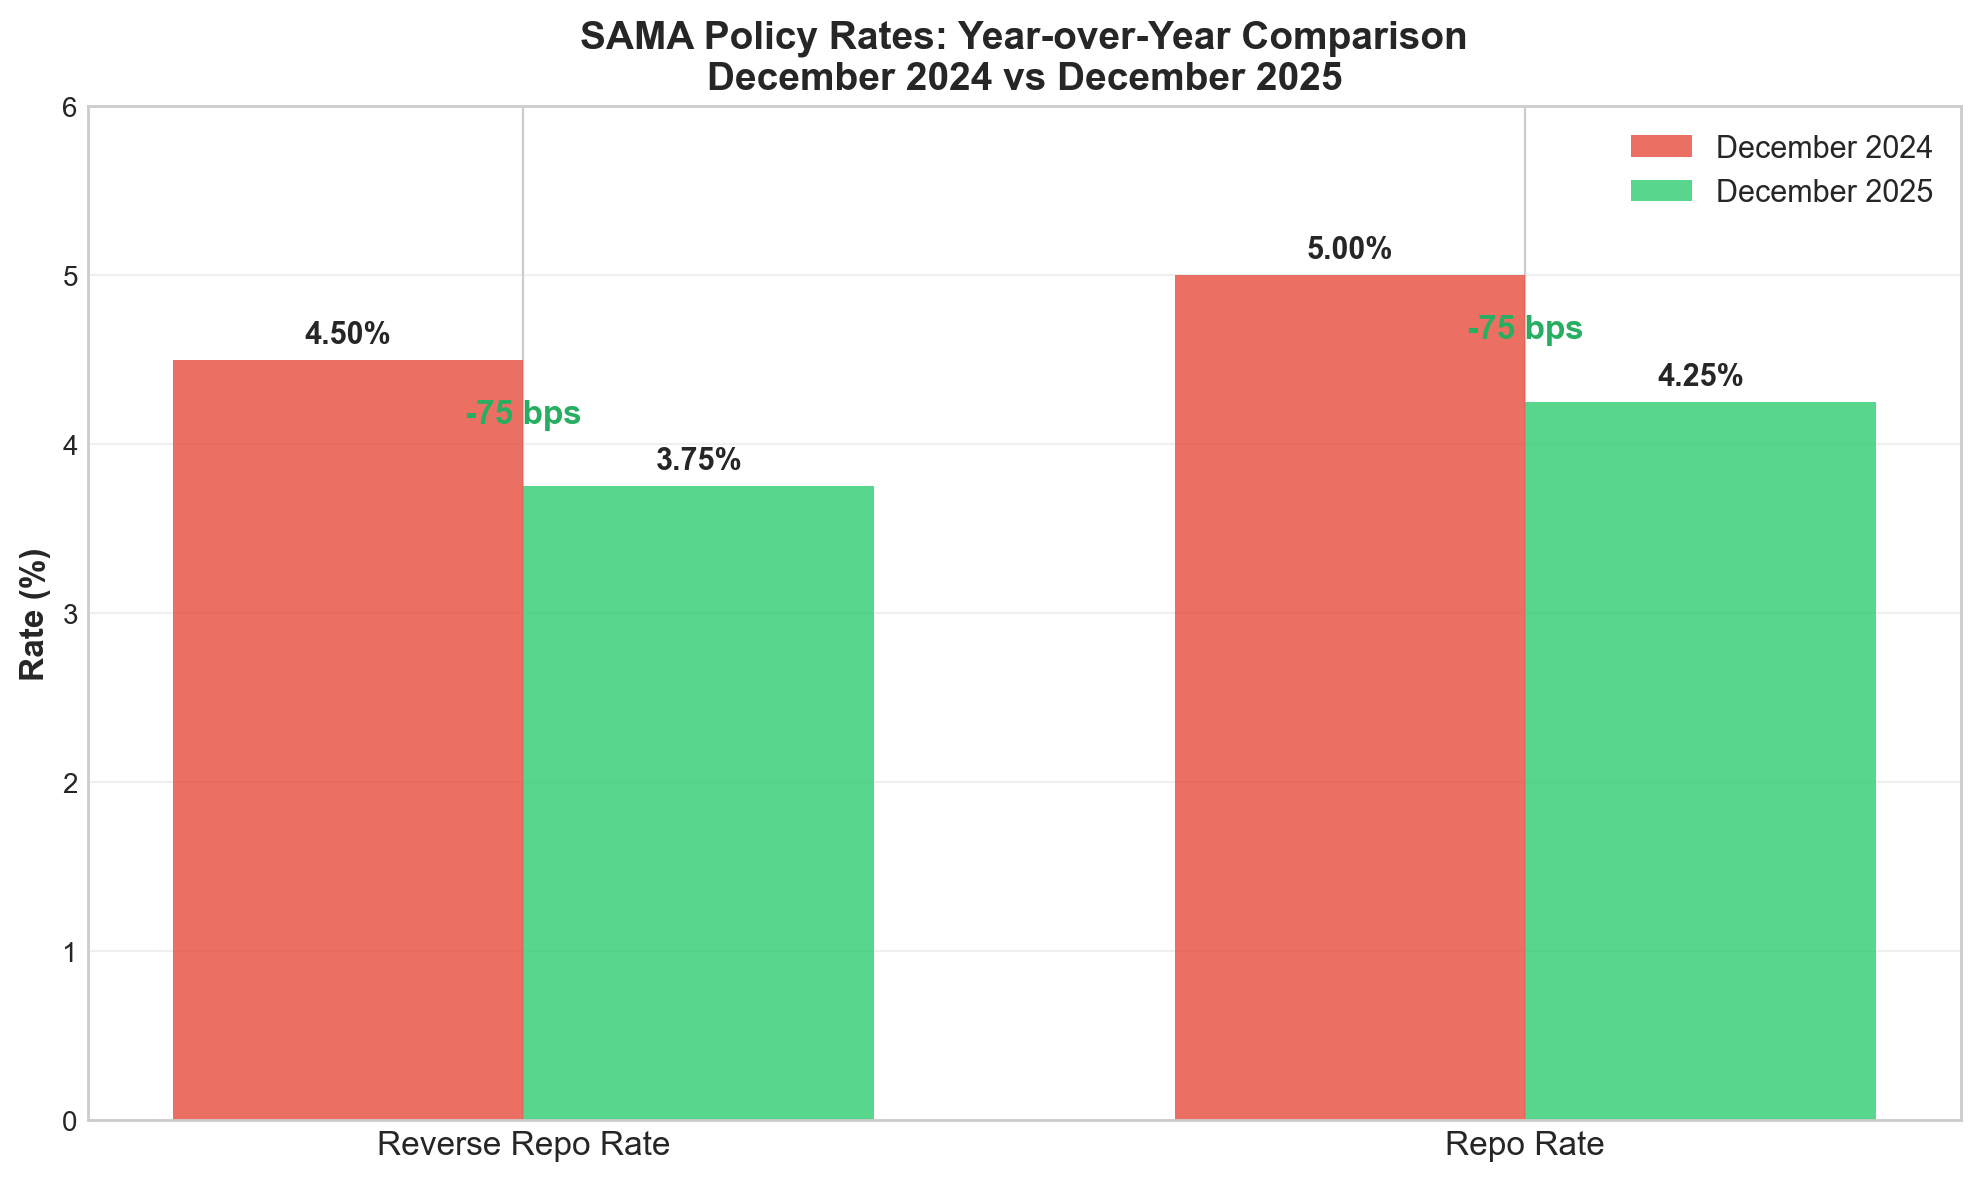
Figure 5: SAMA policy rates comparison — December 2024 vs December 2025.
| Rate | Dec 2024 | Dec 2025 | Change |
|---|---|---|---|
| SAMA Reverse Repo | 4.50% | 3.75% | -75 bps |
| SAMA Repo | 5.00% | 4.25% | -75 bps |
The lower short-end rates have steepened the yield curve. For entities with long-duration liabilities, this means a larger term premium but also greater sensitivity to duration estimates.
Yield Curve Comparison: December 2024 vs December 2025
For a more granular view, we compare the FTSE Saudi Arabian Government Bond Index (SAGBI) data from December 2024 against our smoothed spot rates for December 2025:
| Maturity | FTSE SAGBI YTM Dec 2024 |
Numerica Spot Rate Dec 2025 |
Change |
|---|---|---|---|
| 1-3 years | 5.17% | 4.30% | -87 bps |
| 3-5 years | 5.19% | 4.53% | -66 bps |
| 5-7 years | 5.36% | 4.87% | -49 bps |
| 7-10 years | 5.52% | 5.14% | -38 bps |
| 10+ years | 5.83% | 5.54% | -29 bps |
The pattern is clear: short-end rates have fallen materially (87 bps at the 1-3 year point), tracking SAMA’s policy rate cuts. The middle of the curve shows moderate declines. At the long end, rates are roughly flat to slightly higher — the 30-year point has actually risen. The net effect is a significantly steeper curve, meaning duration assumptions now carry more weight in valuations than they did a year ago.
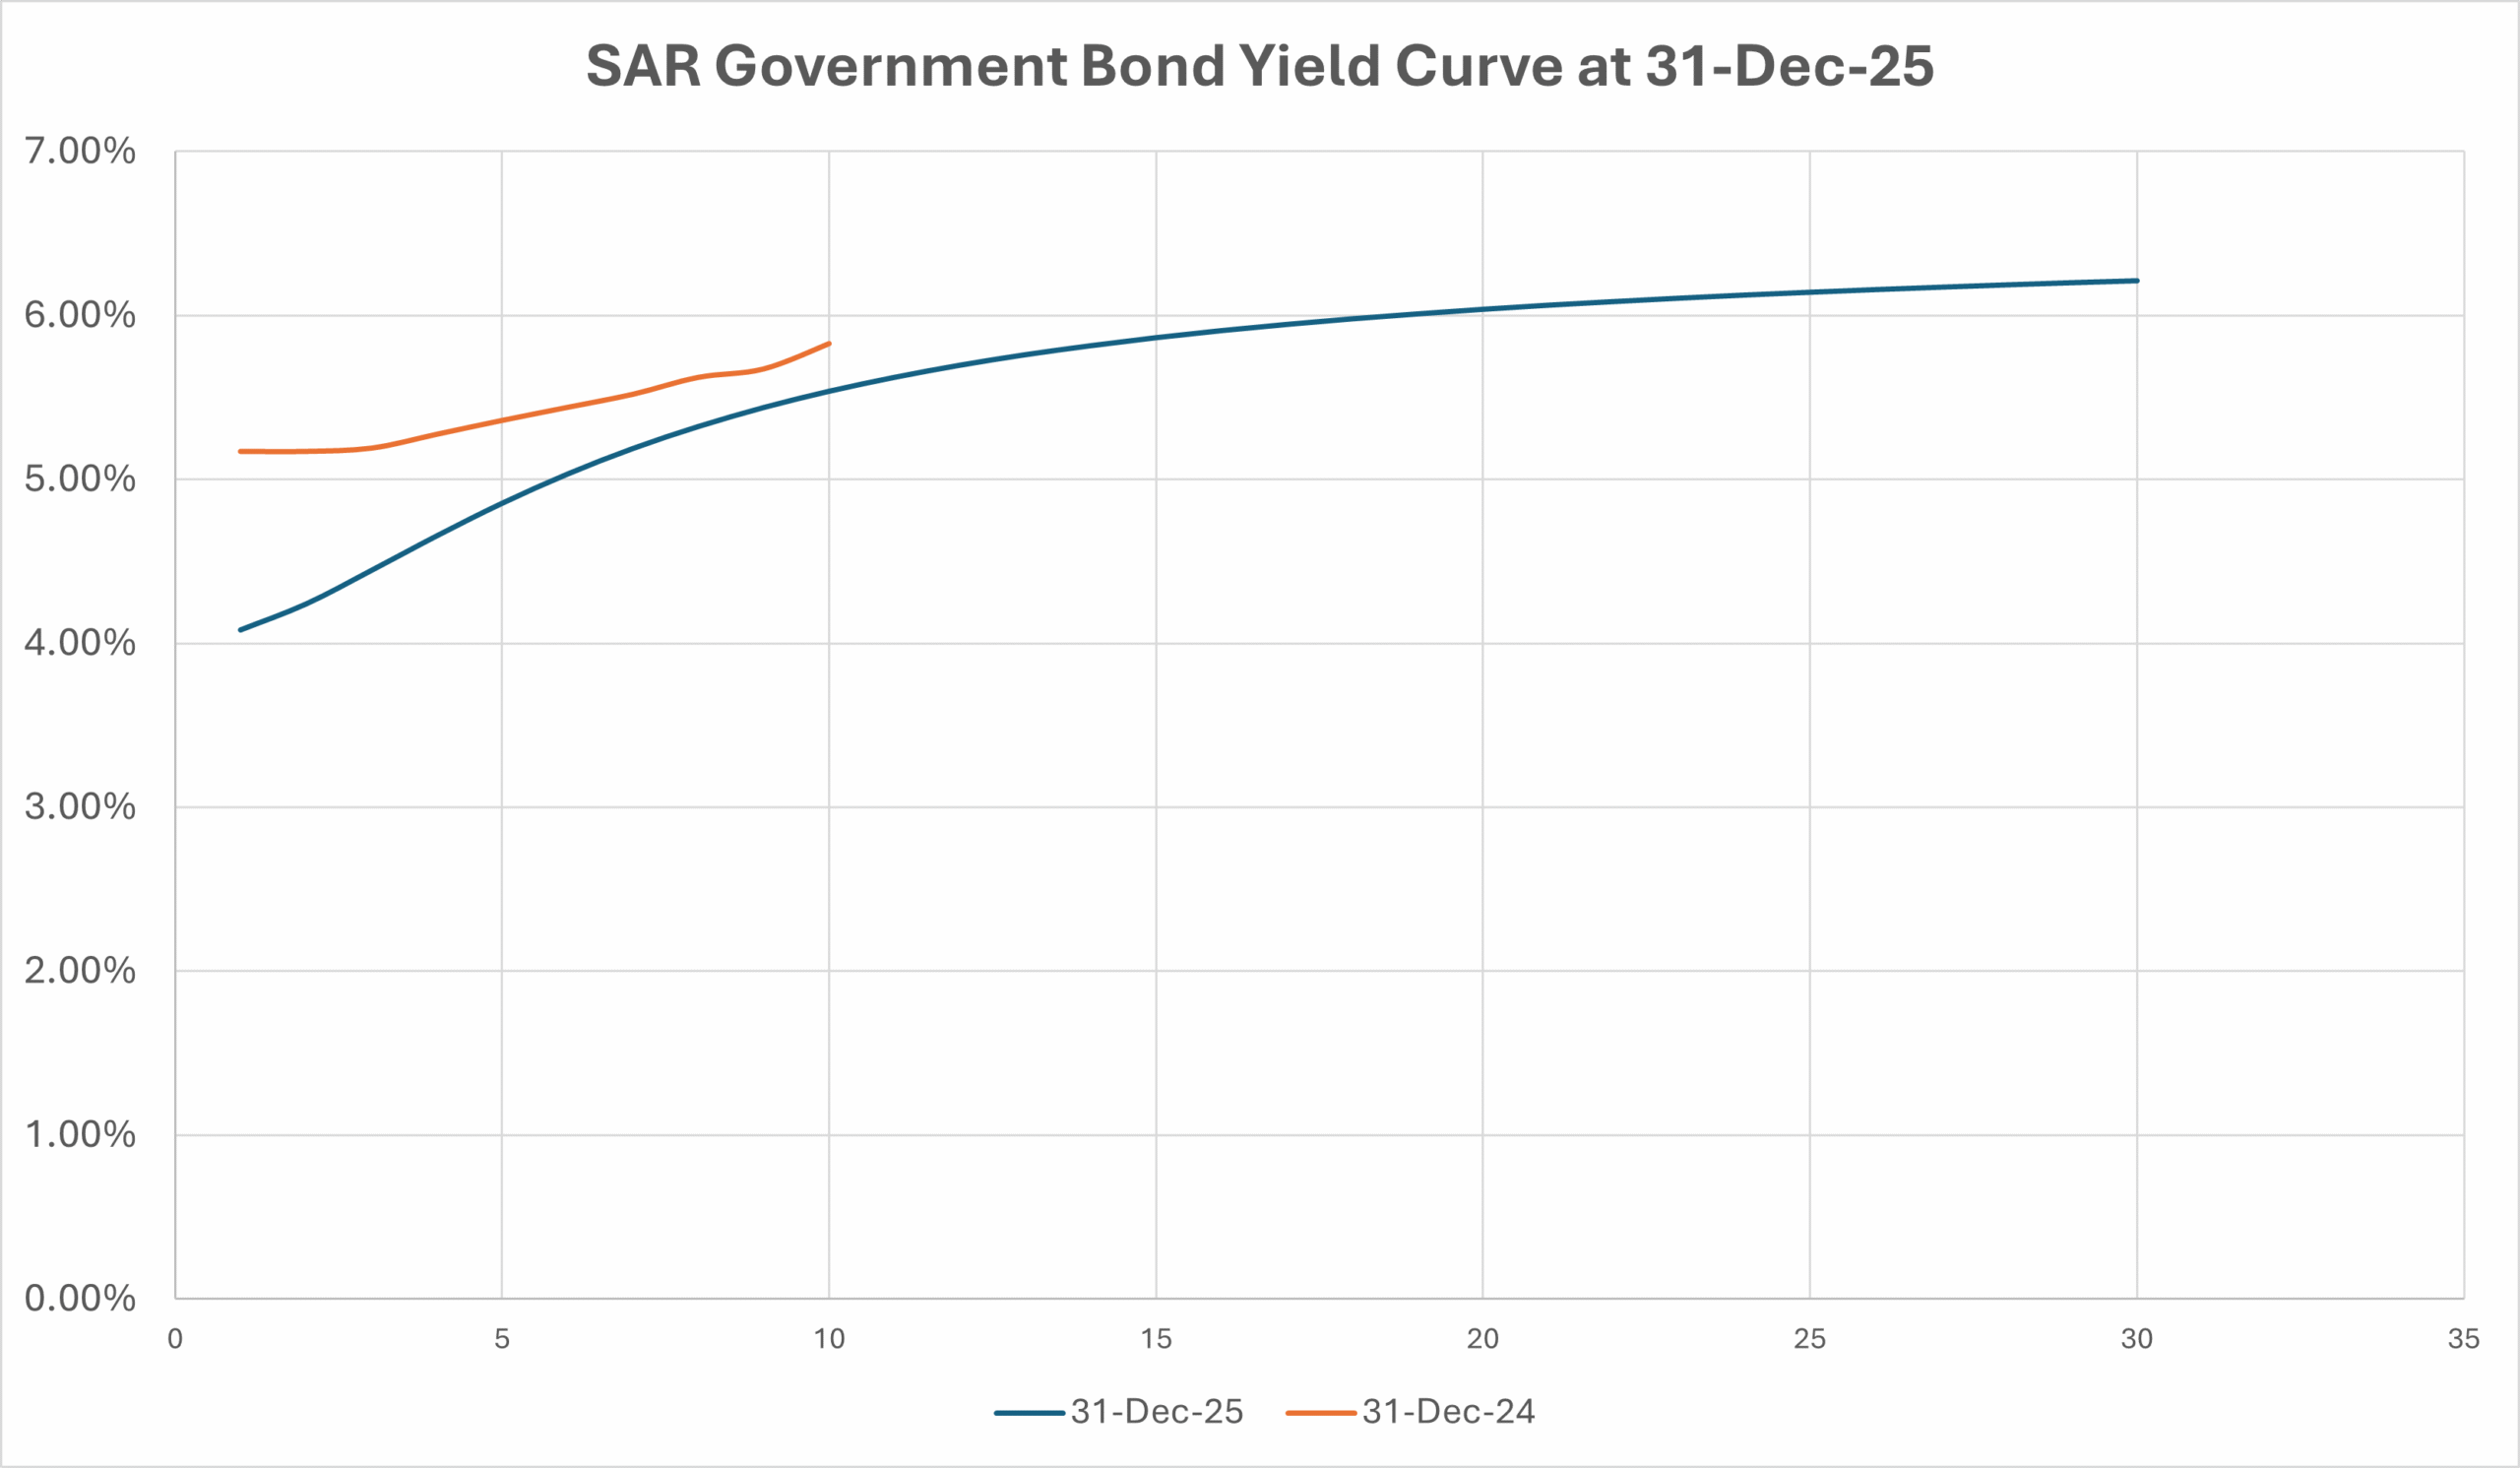
Figure 6: Yield curve comparison — December 2024 vs December 2025.
Comparison Limitations
The December 2024 figures are from the FTSE Saudi Arabian Government Bond Index, which reports yield-to-maturity across broad maturity buckets — not spot rates on a continuous curve. YTM and spot rates differ, particularly for longer maturities, so the comparison is indicative rather than precise. Our December 2025 figures are smoothed spot rates derived from Nelson-Siegel curve fitting. Also note that no data is available for 31-Dec-24 for durations in excess of 10 years.
7. Frequently Asked Questions
Why can’t I use USD Treasury yields for Saudi valuations?
IAS 19 paragraph 83 requires the discount rate to be determined by reference to market yields on instruments denominated in the same currency as the benefits. Since EOSB and other Saudi employee benefits are paid in SAR, only SAR-denominated government bonds are compliant. The SAR-USD peg does not make them economically equivalent for this purpose. See our full explanation of common mistakes.
What about using other GCC yield curves?
Other GCC curves (UAE, Qatar, Kuwait) are denominated in different currencies and violate the currency-matching requirement. Even though these currencies are also pegged to USD, the obligation is in SAR, so the discount rate must come from SAR instruments.
How often should I update the discount rate?
The discount rate should be determined as at your reporting date. For interim reporting, you may use the most recent reliable data, but annual valuations require rates as at the balance sheet date. Our live discount rate page is updated regularly.
What is the significance of the smoothing alpha?
The smoothing alpha (78.5% on December 31) indicates how much weight to give today’s trading data versus historical patterns. A high alpha means today’s data is highly reliable, and the curve closely reflects current market prices. A low alpha (e.g., on days with thin trading) means more reliance on historical patterns.
How does this affect my P&L and OCI?
Lower discount rates increase the present value of liabilities. Since rates have fallen YoY, any increase in liability from the rate change flows through OCI (as a remeasurement) rather than P&L. The service cost and net interest for 2026 will be calculated using the December 2025 rate.
Is this curve applicable for IFRS 17?
Yes. IFRS 17 requires a risk-free rate that reflects the currency and timing of cash flows. This SAR government Sukuk curve provides the risk-free component. Insurers may add an illiquidity premium depending on the characteristics of their liabilities.
Related Resources
Need Help with Your Year-End Valuations?
Data source: Saudi Exchange (Tadawul). Curve construction uses Nelson-Siegel methodology with Bayesian temporal smoothing. This analysis is for informational purposes only and should be reviewed by a qualified professional before use in financial statements.