It is the end of another financial year and time for companies to prepare their year-end financial statements for FY 2017-18. The discount rate for actuarial valuation as at 31 March 2018 is now known. This post explains the movement in the interest rate curves over the FY 2017-18 and how that is expected to affect their employee benefit liabilities.
Comparison of yield curves: 31 Mar 2018 vs 31 Mar 2017
The discount rate as at any particular valuation date is read from the yield curve of GoI bonds as at that date. Since 31 March 2018 fell on a weekend (non-trading day), the usual practice is to consider the discount rate at the immediately preceding trading day; i.e. 28 Mar 2018. Any reference to discount rate as at 31 Mar 2018 in this post, actually refers to the discount rate as at 28 Mar 2018.
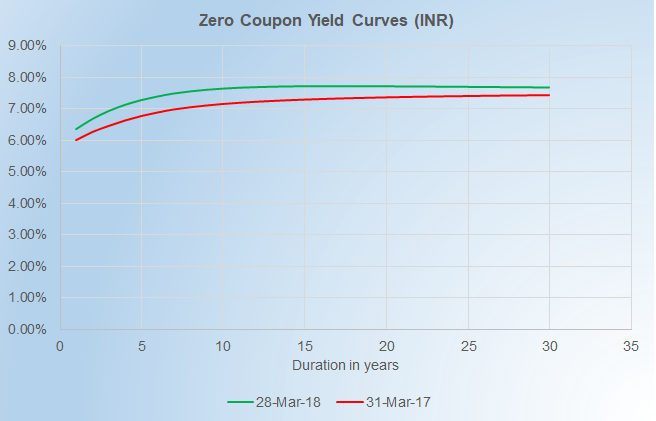
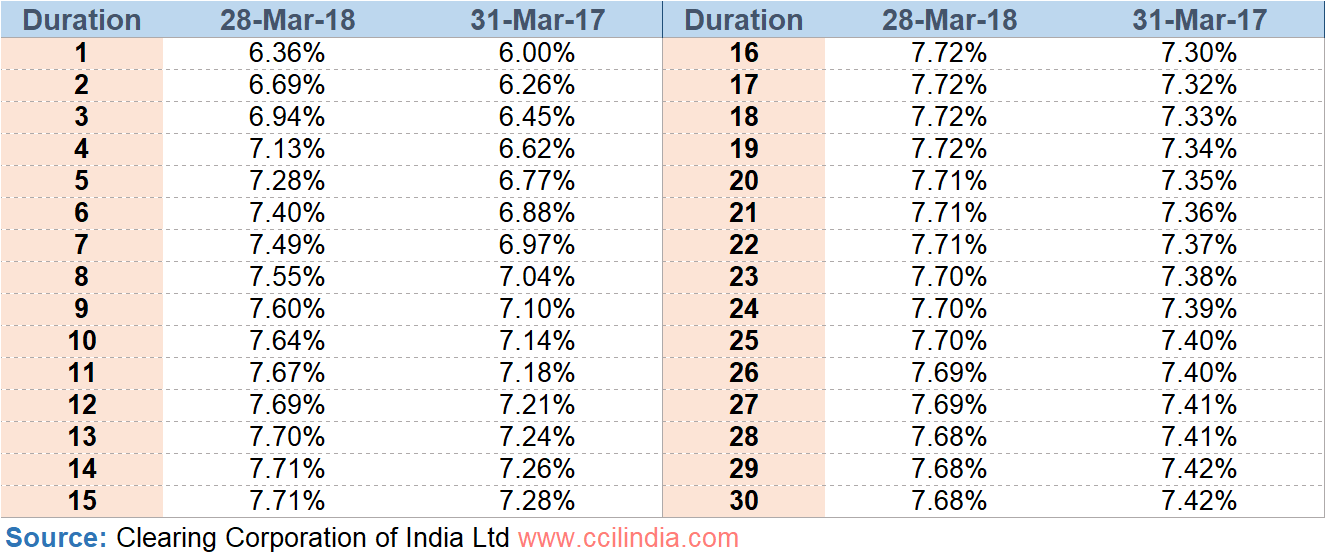
The yield curves as at 31 March 2017 and 31 March 2018 are shown in the chart below. Most gratuity plans have a duration of liability between 5 and 10 years. For this duration range, the yields have increased by around 50 bps (half a percentage) since 31 March 2017.
Also worth noting is the change in ‘shape’ of the curve. The yields have increased more for the shorter durations, i.e. less than 10 years. For longer durations, the curve becomes flatter. The yields at longer durations are still higher than what they were at 31 March 2017, but the increase is not as much as 50 bps. In fact, at duration of 30 years, the increase is just 25 bps.
Most of the increase in yields has occurred during the quarter ended 31 Dec 2017, as is evident from our last discount rate update.
Note: movements in interest rates, discount rates and yields are commonly expressed in terms of ‘basis points’ or ‘bps’. One percentage point is equal to 100 bps (1% = 100 bps)
What this means for you?
All things equal – as yields go up, the DBO goes down. If an actuarial valuation was to be carried out today, almost all companies would see a fall in their DBO (liability), assuming all other things are kept unchanged.
For companies which have set aside funds with an insurer, the changes in yield curve could also affect the value of those funds. Usually, a significant portion of these funds is invested in fixed income bonds issued by GoI or corporates, whose values also go down as yield curves rise, which could partially offset the benefit of decrease in DBO.
It is also worth nothing that the recent increase in gratuity limit is likely to increase the DBO further. Read about it here.
For more information about how discount rate is set for actuarial valuation, please read this post here.
Source of the discount rate for actuarial valuation
Numerica uses the yield curves published by the Clearance Corporation Of India (CCIL) derived from the trades in GoI bonds on the National Stock Exchange (NSE). The yield curves produced by NSE/CCIL have been in use for over two decades now and areconsidered to be the true reflection of the interest rates in the Indian economy.
Numerica regularly collates and publishes the prevailing discount rates on this webpage.
Download our guide on transitioning to Ind AS from an employee benefits perspective by clicking on the picture below: