For many companies, this is the time to finalise their interim accounts for the third quarter of FY 2017-18. An understanding of the movement in discount rate during this period will help in making an appropriate provision towards employee benefits liabilities.
Comparison of yield curves: 31 Dec 2017 vs 31 Mar 2017
The discount rate as at any particular valuation date is read from the yield curve of GoI bonds as at that date. Since 31 Dec 2017 fell on a weekend (non-trading day), the usual practice is to consider the discount rate at the immediately preceding trading day; i.e. 29 Dec 2017. Any reference to discount rate as at 31 Dec 2017 in this post, actually refers to the discount rate as at 29 Dec 2017.
The yield curves as at 31 March 2017 and 31 December 2017 are shown in the chart below. On an average, the yields have increased by around 40-50 bps since 31 March 2017. Most of the increase in yields has occurred during the last quarter, as is evident from our last discount rate update.
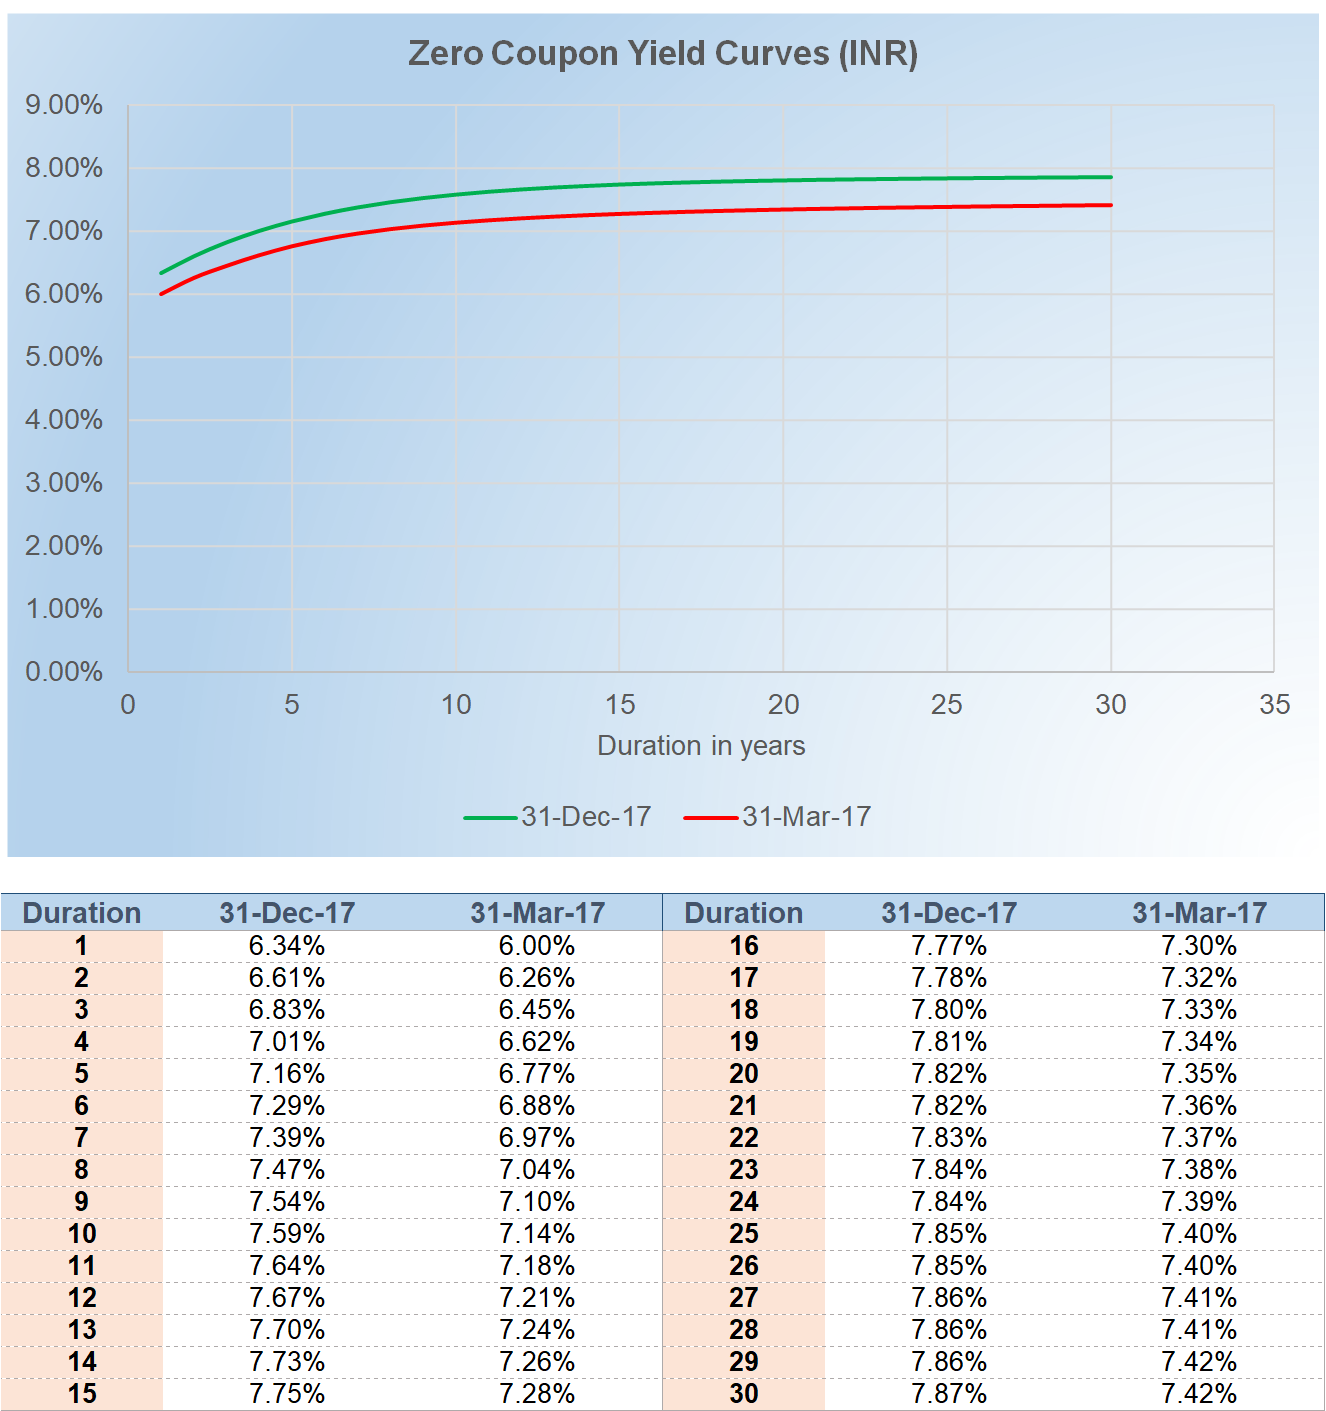
Compared to 30 Sep 2017 (not shown in the above graph and table), the yields have increased substantially.
What this means for you?
All things equal – as yields go up, the DBO goes down. If an actuarial valuation was to be carried out today, almost all companies would see a fall in their DBO (liability), assuming all other things are kept unchanged.
For companies which have set aside funds with an insurer, the changes in yield curve could also affect the value of those funds. Usually, a significant portion of these funds is invested in fixed income bonds issued by GoI or corporates, whose values also go down as yield curves rise, which could partially offset the benefit of decrease in DBO.
For more information about how discount rate is set for actuarial valuation, please read this post here.
Source of the discount rate for actuarial valuation
Numerica uses the yield curves published by the Clearance Corporation Of India (CCIL) derived from the trades in GoI bonds on the National Stock Exchange (NSE). The yield curves produced by NSE/CCIL have been in use for over two decades now and are considered to be the true reflection of the interest rates in the Indian economy.
Numerica regularly collates and publishes the prevailing discount rates on this webpage.
Download our guide on transitioning to Ind AS from an employee benefits perspective by clicking on the picture below: